All apps
Weather · DK

ByVejr – DMI & Yr

Forecasts from DMI and Yr side by side, with no waiting.

What it does

ByVejr pulls forecasts from both DMI and Yr so you can compare two sources for the same town. Fast to open and built to answer straight away.

  • Two forecast sources per town
  • Hourly and daily outlook
  • Rain radar
  • Lightning nearby — map and alert
  • Your towns saved on the front page
How it works

The whole forecast, without hunting for it

ByVejr gathers what normally takes four apps: the official Danish forecast from DMI, the Norwegian one from Yr, the radar, the official warnings, the water around the country and the sky above it. All in one place, and always with the source printed next to the number.

01

The front page answers before you ask

The app opens on the weather it saw last, read from the phone's own disk rather than the network. That takes milliseconds. Meanwhile it finds your position and fetches fresh numbers in the background, and the page updates itself when they land. There is never a blank screen with a spinner on it.

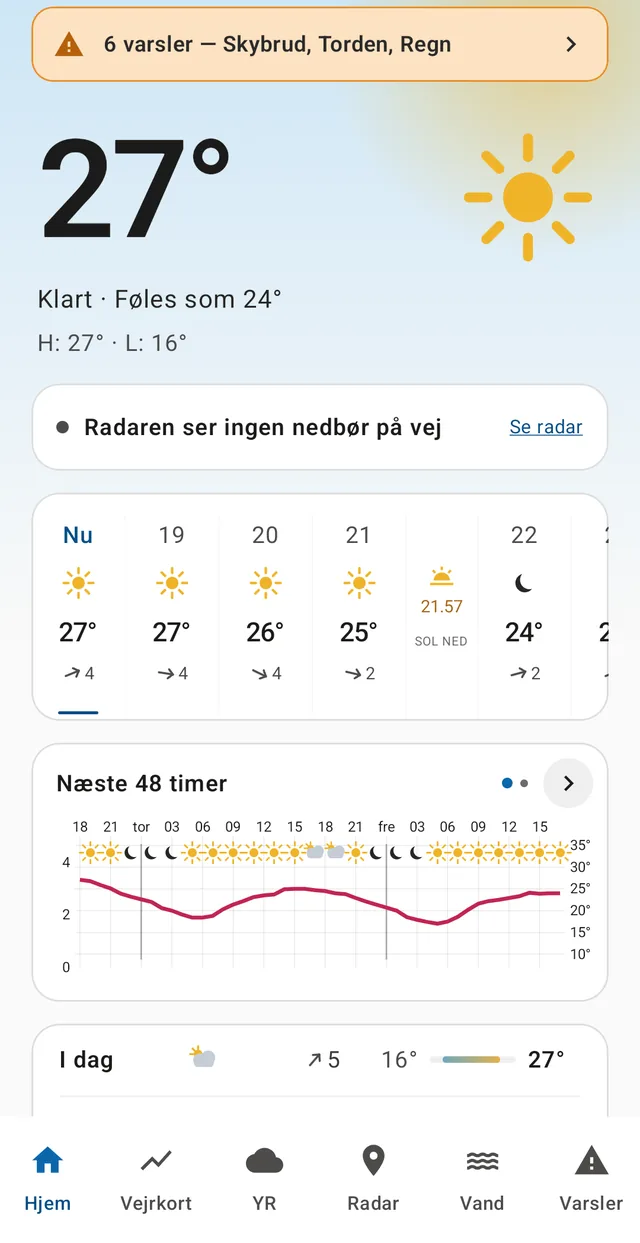
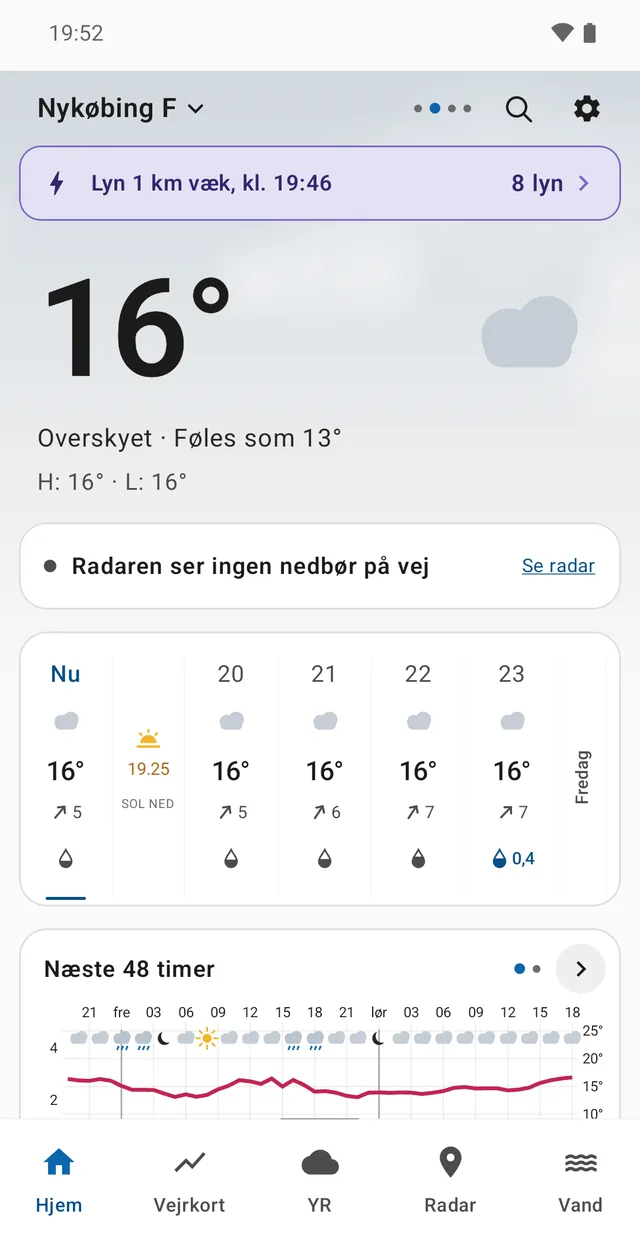
The temperature is at the top, along with how it feels and the day's high and low. Right below it sits the one line most people came for: whether the radar can see precipitation heading your way within the next ninety minutes. Then the hours, with sunrise and sunset placed at their real position in the row, and a 48-hour chart with the temperature curve and the precipitation bars drawn on top of each other.

If a warning is in force for your municipality, an orange banner appears at the top — and an extra tab at the bottom. If there is nothing, there is neither banner nor tab. The tab showing up is the message.

  • The last forecast is drawn straight from disk
  • The precipitation line says whether rain is due within 90 minutes
  • Warning banner and Warnings tab appear only when a warning is actually in force
  • Swipe sideways to move between your saved towns
The front page in a town with six warnings in force: the precipitation line, the hour row with sunset, and the 48-hour chart.
02

Two forecasts, one gesture

DMI and Yr do not always agree. They run different models, and the gap is widest exactly where it matters: whether the rain falls in the morning or holds off until the evening.

Most weather apps make you pick a source in the settings. ByVejr does the opposite: hold your finger on the screen and the numbers switch to Yr. Let go and they are back on DMI. You compare by pressing, not by navigating back and forth.

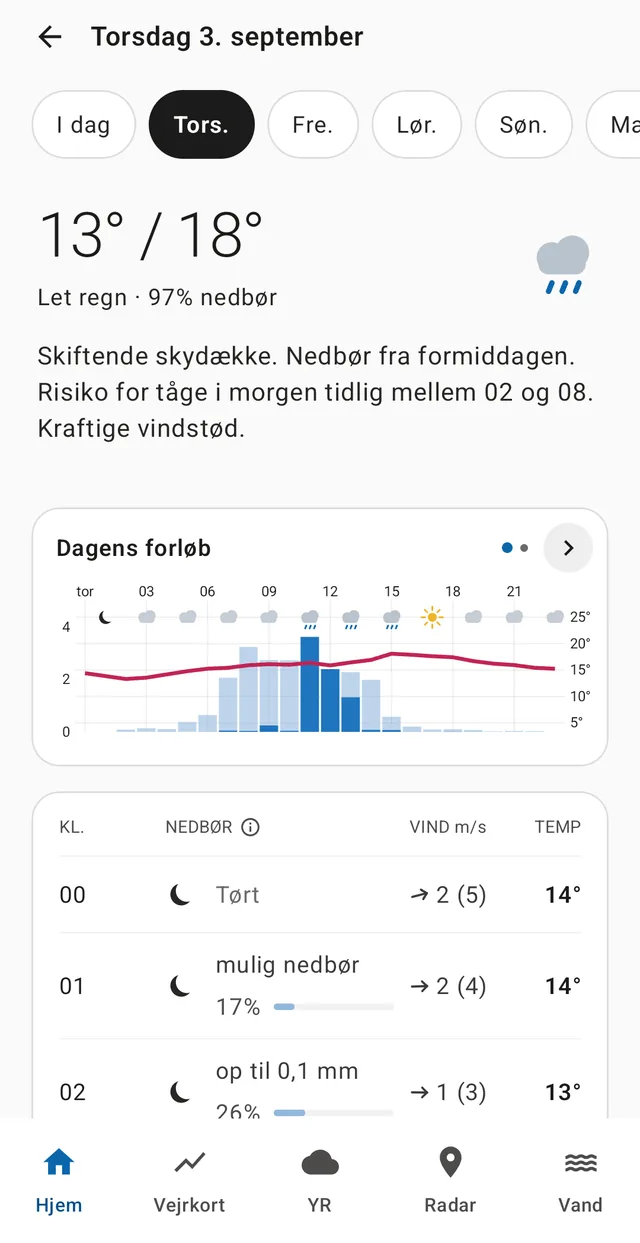
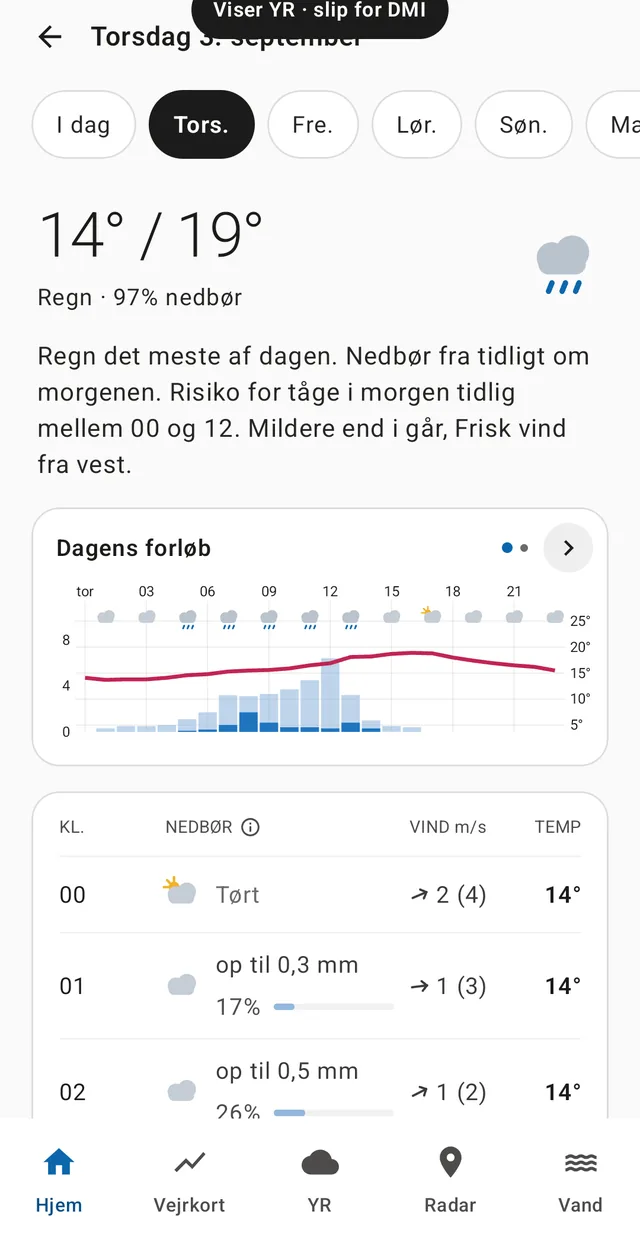
The two shots here were taken two seconds apart on the same day. DMI says 13°/18° and 'light rain'; Yr says 14°/19° and 'rain'. The written summary differs too — DMI has precipitation from mid-morning, Yr has rain for most of the day. That is exactly the kind of disagreement you want to know about before planning a day outdoors.

The gesture works on the front page, in the day view and on the chart tab. If you would rather see Yr's own page, it sits as a tab of its own, always opened on the town you are looking at.

  • Hold to see Yr, release to return to DMI
  • The whole page switches: hero, hours, chart and day list
  • A badge at the top reads 'Showing YR · release for DMI', so you always know what you are looking at
  • Yr's own page is available as a separate tab
DMI: 13°/18°, light rain, precipitation from mid-morning.
Same day, same second — the finger is held down, and Yr says 14°/19° with rain for most of the day.
03

The day in words — and the meteorologist's own text

Above the chart sit two or three sentences about the day: what characterises it, what changes, and what you will actually feel. 'Variable cloud. Precipitation from mid-morning. Risk of fog early tomorrow between 02 and 08.'

The text never repeats numbers already on the screen — it adds timing and interpretation. If the day is quiet and uneventful, it says one short sentence rather than filling in a template. It is written by the app itself from fixed rules, not by a language model: that makes it free, instant, usable offline, and incapable of inventing anything.

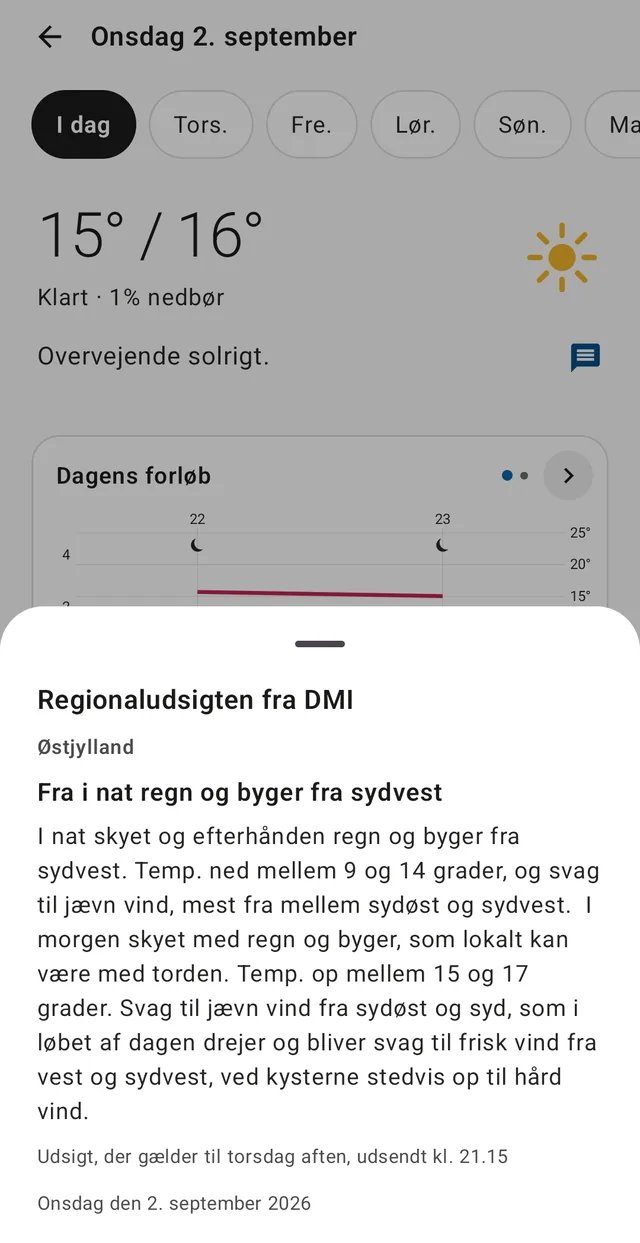
Next to it sits a message icon. Behind it is DMI's regional outlook — the meteorologist's own written forecast for your part of the country, word for word as it appears on dmi.dk. The icon shows only for Danish towns and only for the nearest 24 hours, because that is what the text covers.

The regional outlook for East Jutland, written by a meteorologist and fetched straight from DMI.
04

Precipitation: four answers, depending on how far ahead you look

Rain is the one thing in a forecast people check several times an hour, so the app has four different answers depending on how far ahead you are looking.

The next 90 minutes sit on the front page as a bar chart in five-minute steps, coloured by intensity, with a line reading 'Rain starts in about 20 min' or 'Dry for the next hour'. In Denmark it is calculated from DMI's radar images — see the section below.

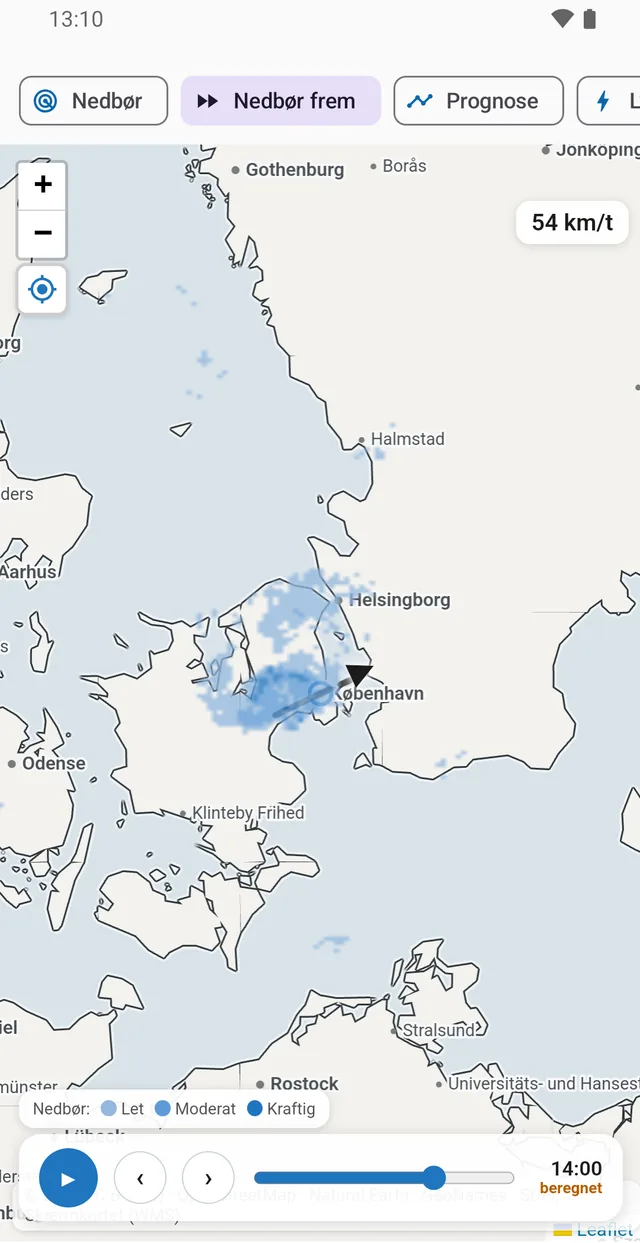
The next two hours across the country live under 'Precipitation ahead' in the Radar tab: DMI's radar written forward in time on a real map.

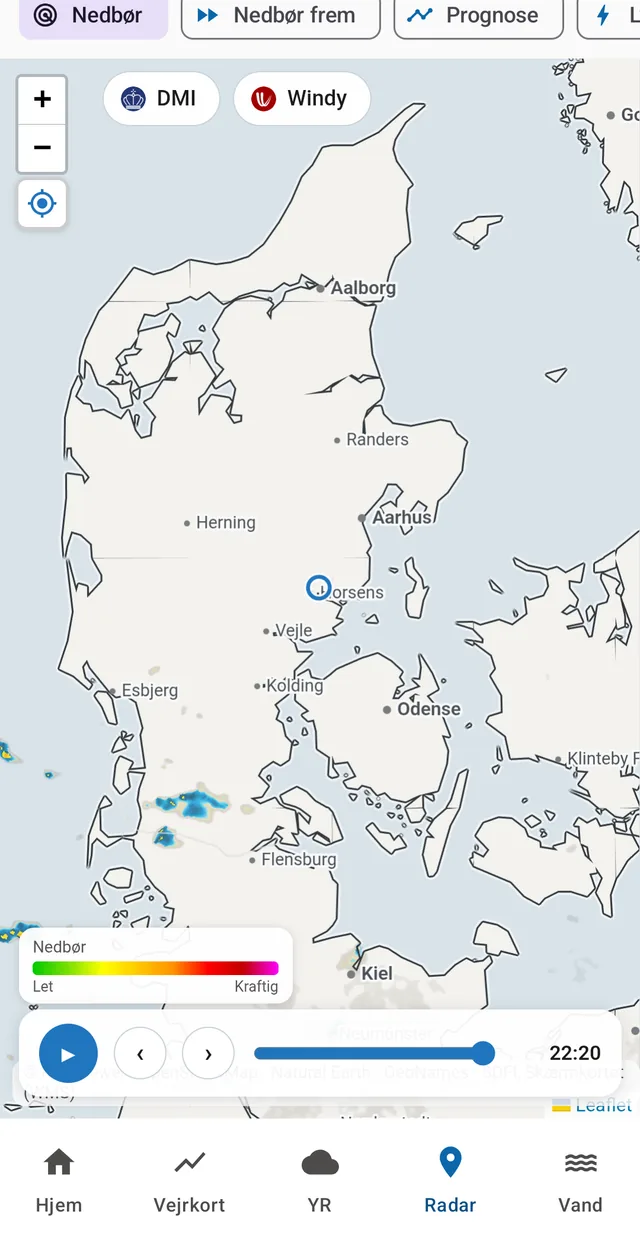
Right now is the ordinary precipitation radar, which can be played back in time. Alongside it sit lightning, Windy and DMI's own map.

The rest of the week comes from the forecast models. Here exactly one place in the app adds millimetres together — the front page, the day list and the day view cannot contradict each other, because they read the same calculation. If the probability does not match the amount, the number is withheld rather than shown wrong, and after seven days the millimetres disappear entirely, because by then they are noise.

The precipitation radar with playback, and the buttons for DMI's and Windy's own maps.
05

The radar images, written forward in time

A forecast model computes on a grid a couple of kilometres wide and therefore misses showers. Radar sees where the rain IS, at 500 metres and with a new image every five minutes — but radar is a measurement, not a forecast: it says where the rain is now, not where it will be in an hour. ByVejr closes that gap itself.

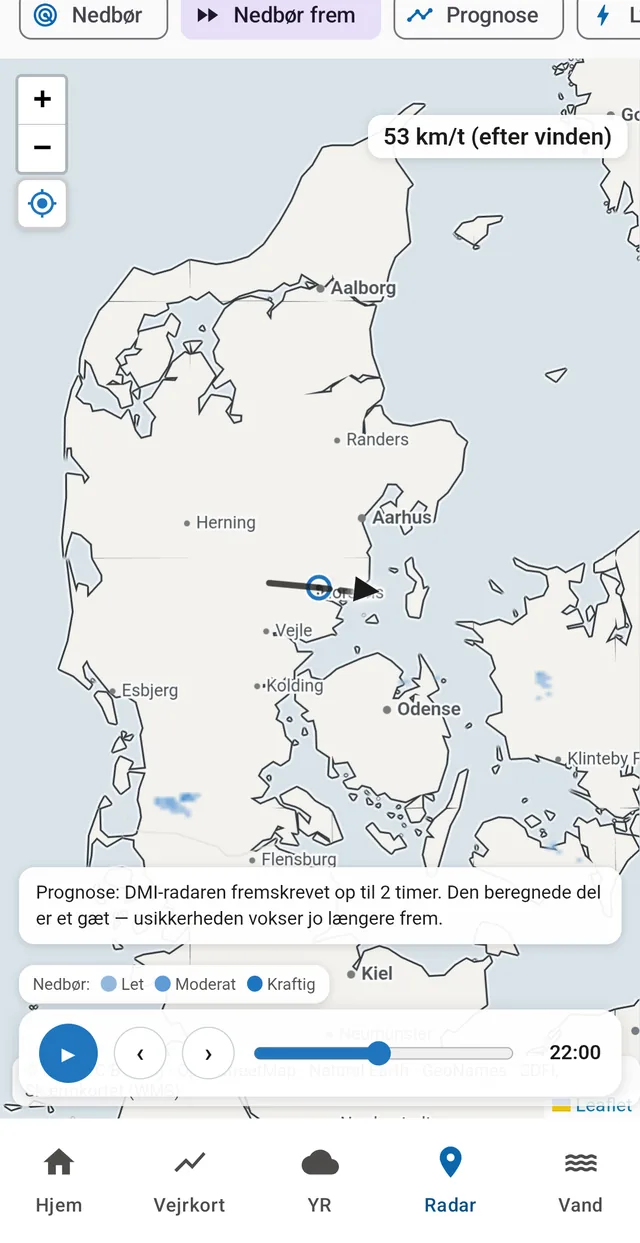
The app fetches DMI's radar images from every radar station in the country, stitches them into one nationwide grid, and compares the most recent images against each other. The displacement between them is measured by cross-correlation — the same approach met.no uses for the Norwegian nowcast — giving a single motion vector: which way the rain field is moving, and how fast. The whole field is then advanced in ten-minute steps, up to two hours. The arrow on the map is that vector, and the number beside it is the speed: 53 km/h with the wind.

It uses the low-level image, not the national composite. The composite takes the strongest echo anywhere in the vertical column and therefore catches rain high up that evaporates before reaching the ground. Measured in Skanderborg on 19 July 2026, the composite said 0.6 mm/h while the low-level image had the place dry — and the place was dry. Low level sits close to the ground, so an echo there means rain that actually falls.

The method assumes the rain moves without changing. That holds for a coherent band of rain and not at all for a shower that forms or dies on the spot. Measured against DMI's own archived images, the projection beats 'assume unchanged' all the way out to two hours, but the gain shrinks the further ahead you look. So the timeline marks every single frame as measured or calculated, and the map says it in words: the projection is a guess, and the uncertainty grows.

The same calculation drives the line on the front page. It rounds — 'in about 15 min', never a time to the minute — because within ±2 km the method catches two out of three arrivals within twenty minutes, but not the individual cell. If the images are too unsettled to give a trustworthy answer, the app writes nothing rather than guessing.

  • DMI radar: 500-metre resolution, a new image every 5 minutes
  • Every station stitched into one nationwide grid
  • The motion is measured between images, not guessed from a model's wind
  • Every frame on the timeline is marked measured or calculated
  • Danish DMI data only (CC BY 4.0) — the layer appears only in Denmark
A rain field west of Copenhagen, projected to 14:00. The timeline reads 'calculated', so it is clear the frame was computed and not measured.
The arrow is the measured motion — 53 km/h with the wind — and the note under the map says for itself that the calculated part is a guess.
06

Ten days ahead — and the way down into a single day

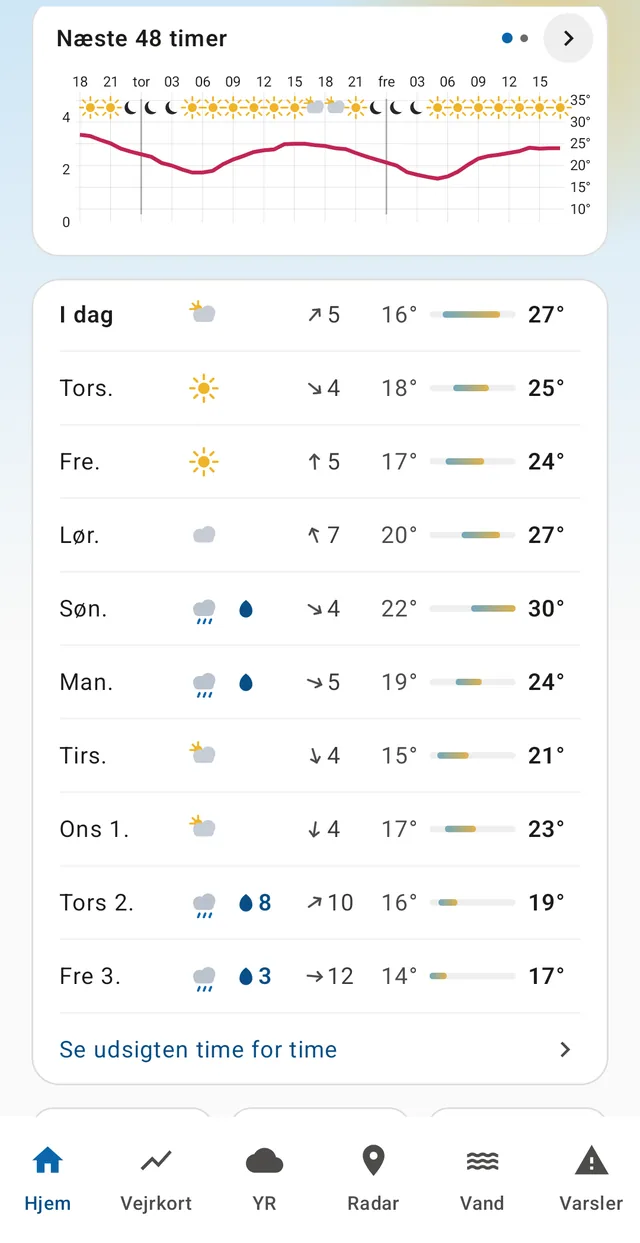
The day list shows ten days with symbol, precipitation, wind and the temperature span as a coloured bar, so you can read the shape of the week without reading a single number.

Tap a day and it opens up: hour by hour with precipitation probability and amount, gusts in brackets, the day as a chart, sunrise and sunset, total precipitation, dew point and when the air reaches it. The day picker stays at the top, so you can page from day to day without going back.

Ten days with the temperature span as a bar — the week reads without numbers.
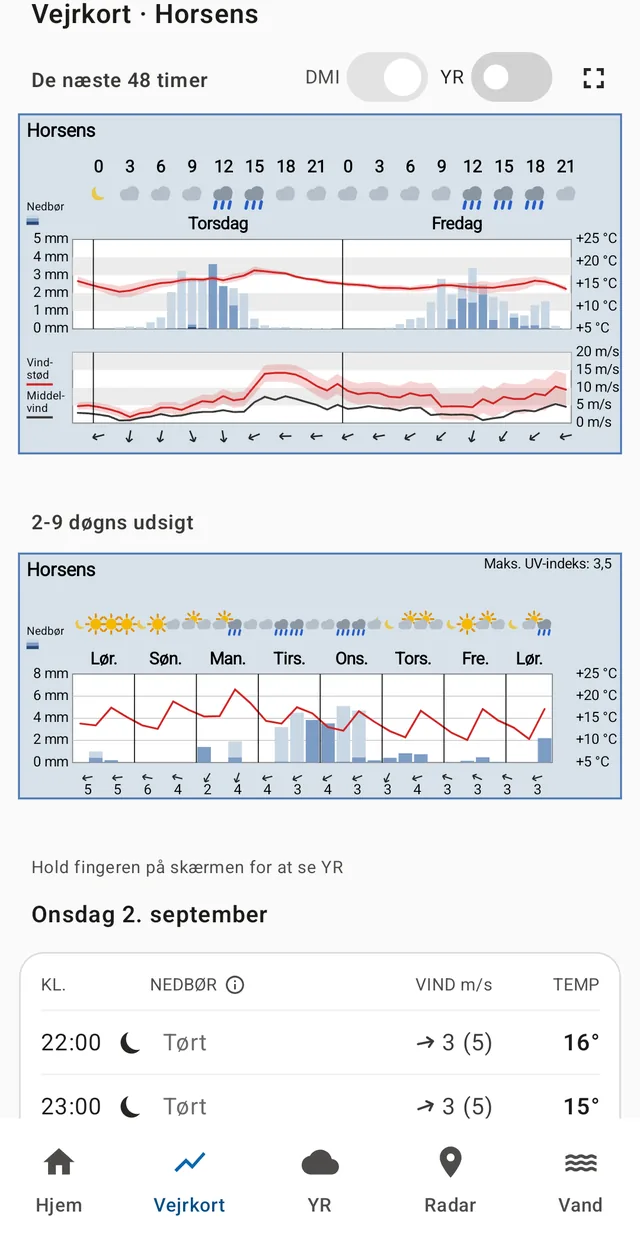
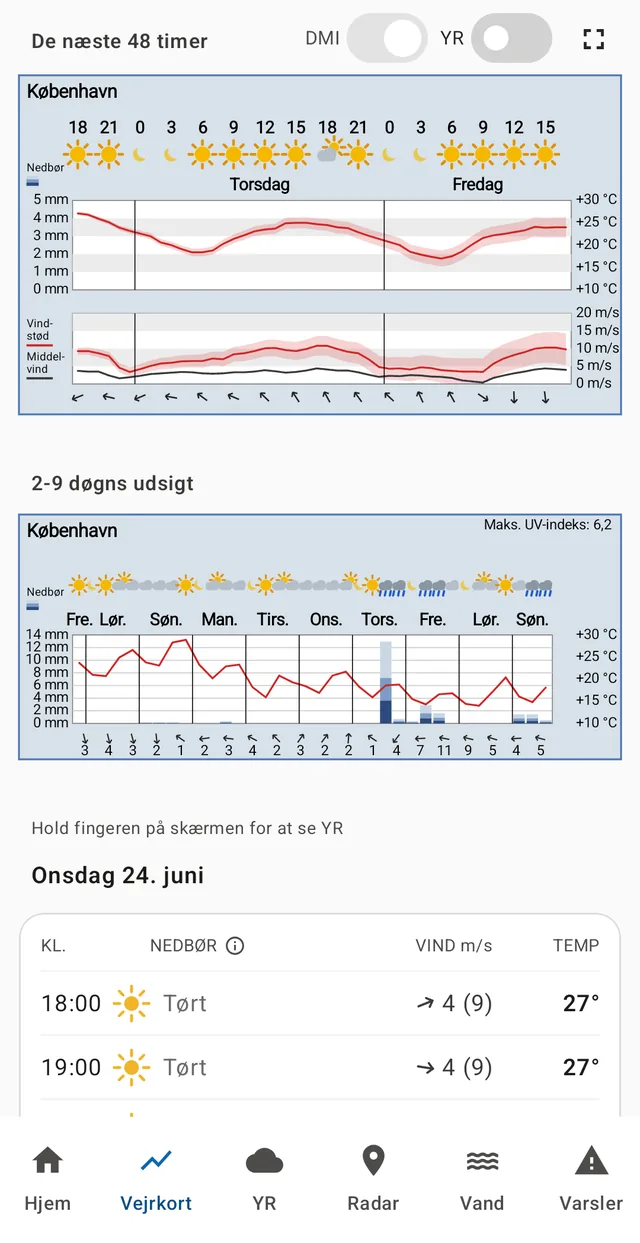
The chart tab: 48 hours and 2–9 days as meteograms with precipitation, temperature, wind and gusts.
07

Official warnings, drawn on the map

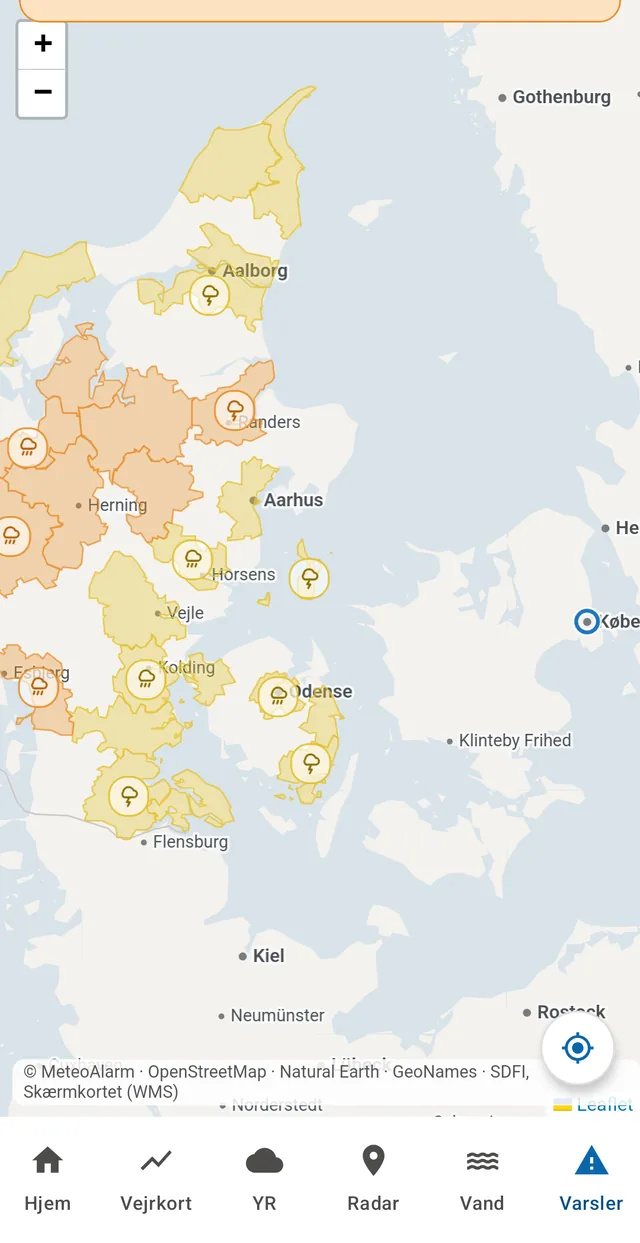
The warnings are DMI's own, taken from the pan-European MeteoAlarm channel. They appear as coloured municipalities on the map — yellow for 'be aware', orange for 'be prepared' — with an icon saying what it is about: cloudburst, thunder, storm, heatwave, raised sea level.

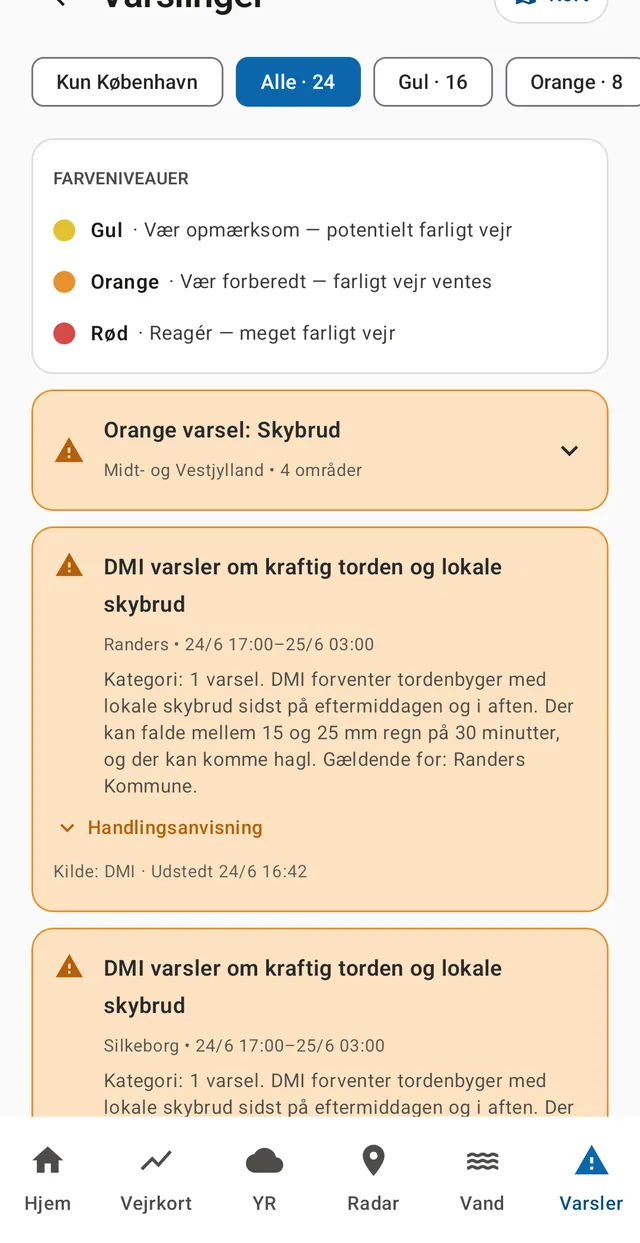
The list behind it is the warning verbatim: what is expected, how severe, over which period, and DMI's own advice on what to do. Nothing in it is written by the app.

Notifications can be turned on for dangerous weather, and if you only want to be disturbed by something affecting your own part of the country, there is a switch for that.

Warnings per municipality. Yellow and orange, with the icon for the warning type.
The same warnings as a list, with DMI's own text and advice.
08

Lightning nearby

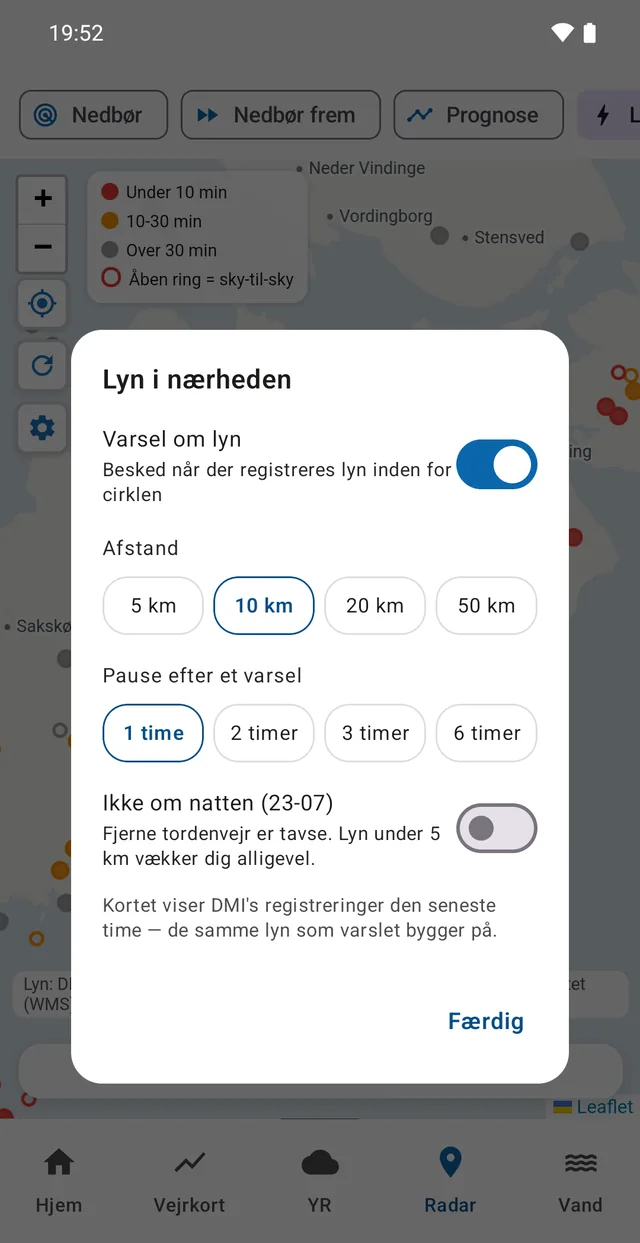
DMI records every single lightning strike in and around Denmark. The Radar tab shows the last hour on the map — coloured by age, with your own position in the middle and a dashed circle at the distance you picked. An open ring is cloud-to-cloud: it never reaches the ground, so it must not look like a ground strike either. The line under the map is the verdict: “23 strikes within 10 km · nearest 2 km”. The front page puts it in one line at the top: “Lightning 1 km away, 19:41” — and that bar needs no setting at all.

Turn the alert on and you get a message when lightning is recorded inside the circle. You choose the distance — 5, 10, 20 or 50 km — how long it should stay quiet afterwards, and whether the night should be silent. A strike closer than five kilometres wakes you anyway, because the thunder follows the flash in under a quarter of a minute. Your position never leaves the phone: the server does not know where you are, it sends the same points to everyone, and your phone works out for itself whether any of them are close enough. The alert is off from the factory and fetches nothing until you switch it on.

From the strike to the message being sent takes typically 3 minutes and 21 seconds — measured on 691 real strikes during the thunderstorm of 15-16 September 2026. Nearly all of that is DMI's own delivery time, and it cannot be made shorter. That does not make the app a safety device. A phone that has been lying still for a while may get the message late, or not at all, and neither we nor the app can tell “no lightning” apart from “the message never arrived”. ByVejr is good at saying that there is a thunderstorm now. It cannot decide whether it is safe to stay on the pitch.

The last hour on the map. Red is under ten minutes, an open ring is cloud-to-cloud, and the dashed circle is the distance the alert uses.
The front page says it without opening the map — even with the alert switched off.
Distance, pause and night silence. The cog on the map opens the very same settings.
09

The water around you

Denmark has 8,750 km of coastline, and a weather app that stops at the air stops too early. The Water tab has four layers.

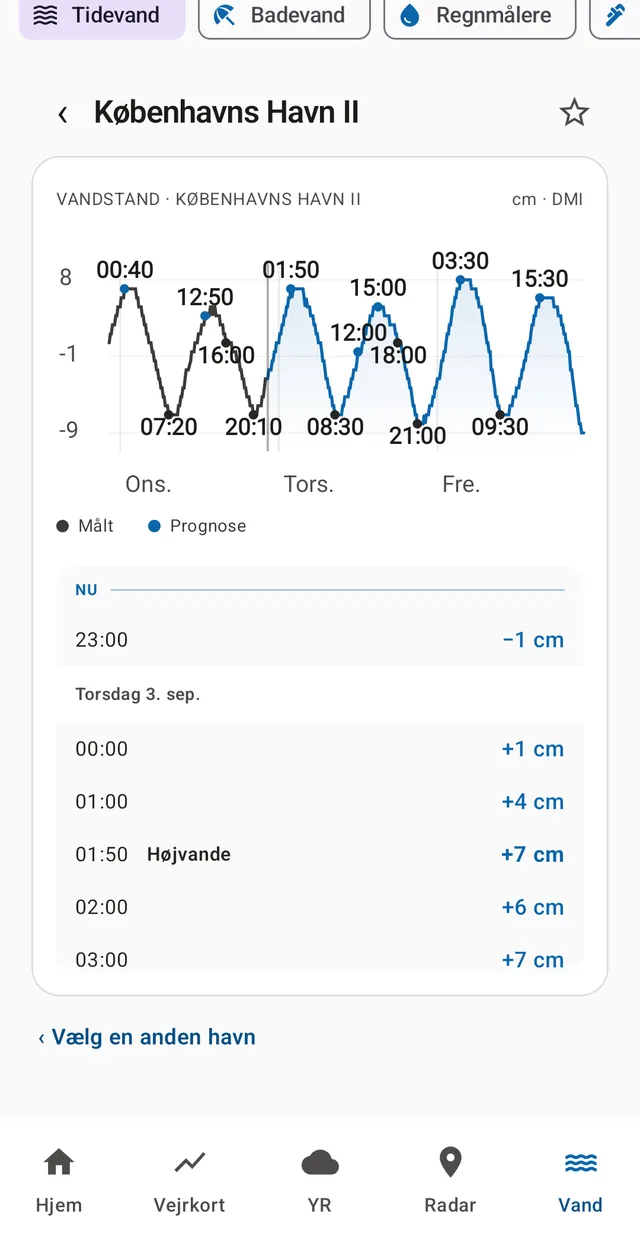
Tides show the sea level in the harbours from DMI's oceanographic model. The chart has measurements in black and the forecast in blue, with high and low water marked and an hourly list underneath. Star your own harbour and the chart follows you to the front page — and stays there whichever town you are looking at, because you follow your own harbour, not the nearest one to wherever you happen to be reading.

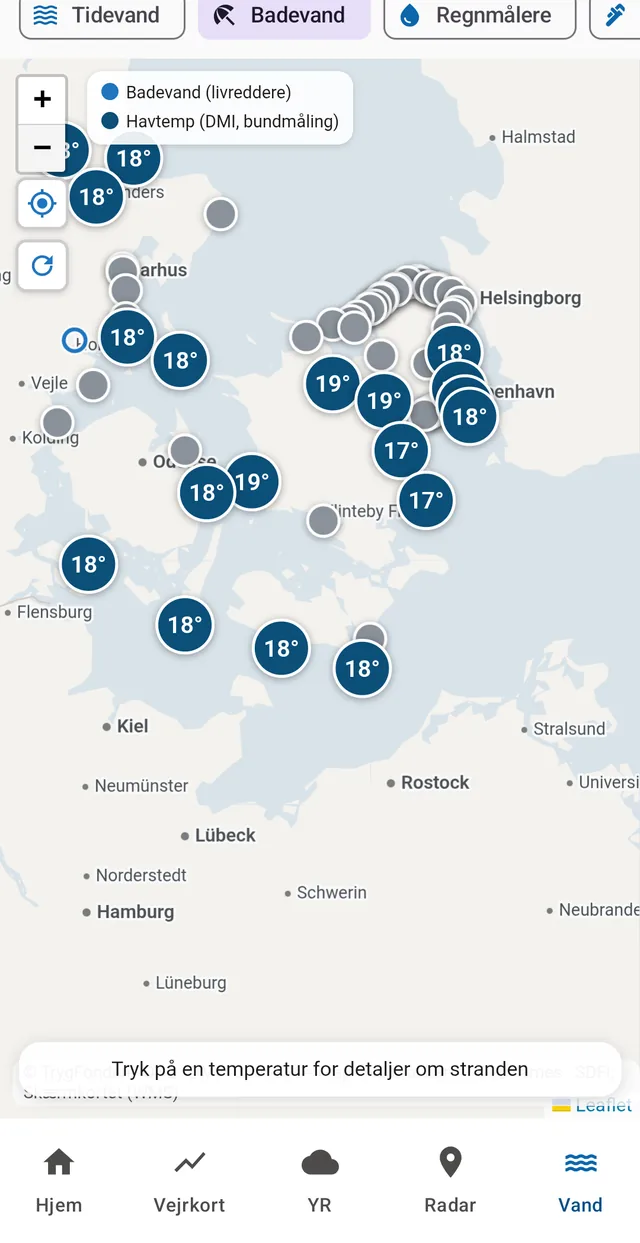
Bathing water puts the lifeguards' beach readings and DMI's sea temperatures on the same map. The two do not measure the same thing: lifeguards measure at one metre's depth close to shore, DMI measures at the bottom by a sea-level gauge — typically colder, but running all year, including out of season. The app says so, so the numbers can be read correctly.

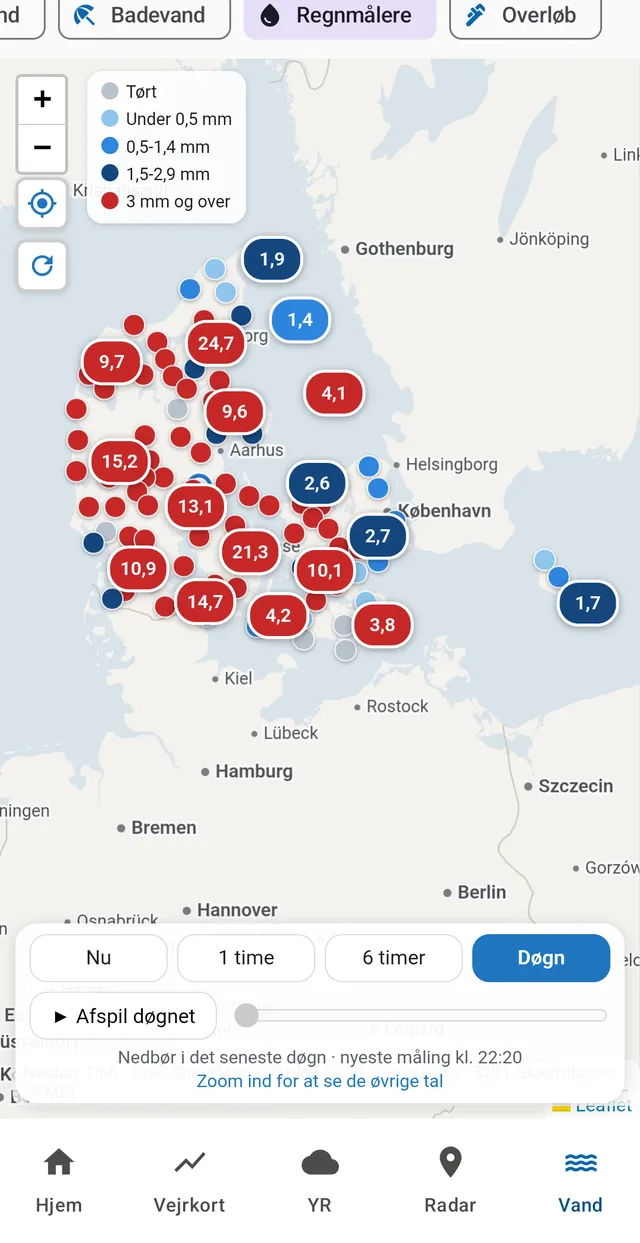
Rain gauges are DMI's stations showing what actually fell — not what the radar guessed. Now, the last hour, six hours or the full day, and a day can be played back like a film.

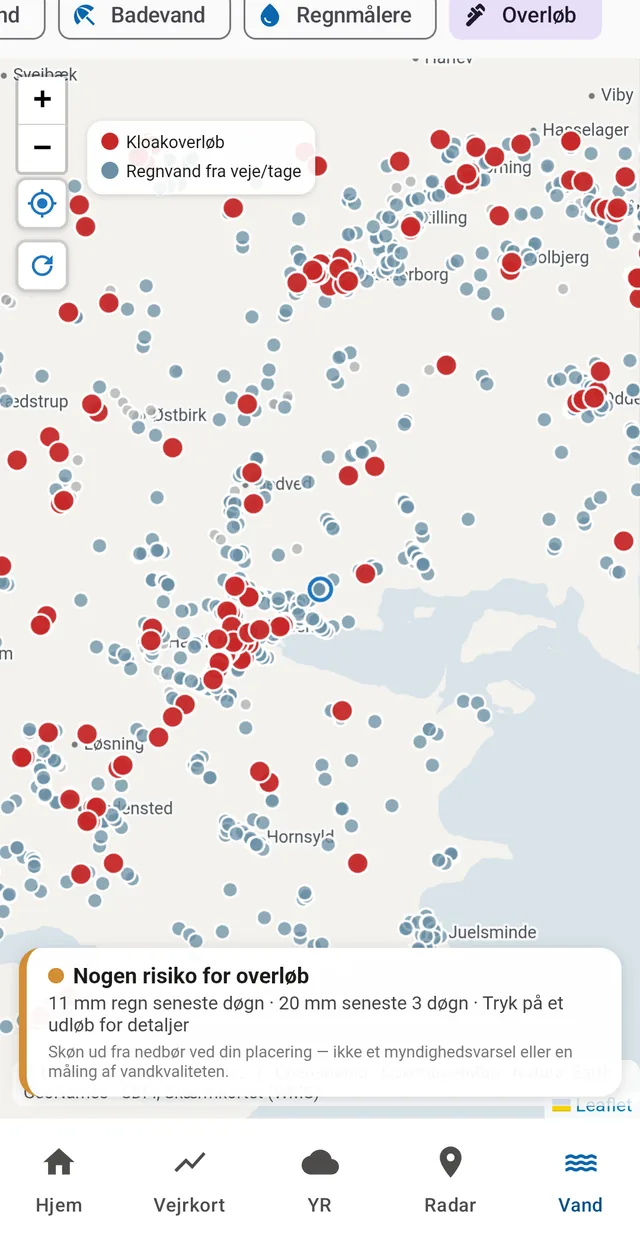
Sewer overflows shows the registered sewer and stormwater outlets from Denmark's Environment Portal together with an estimate of the risk based on how much rain has fallen over the last few days. There is no open source for when an overflow actually happens, so the app does what the model-based services do: it combines the outlet points with measured rainfall. It is help in choosing where to swim, not an official warning and not a measurement of water quality — and it says so.

Sea level in Copenhagen harbour. Black is measured, blue is forecast; the star pins the harbour to the front page.
Sea temperatures from lifeguards and DMI on the same map.
DMI's rain gauges after a wet 24 hours — up to 24.7 mm in West Jutland.
Sewer overflows in red, stormwater outlets in blue, and a risk estimate from the day's rainfall.
10

Tonight's sky — crossed with our own forecast

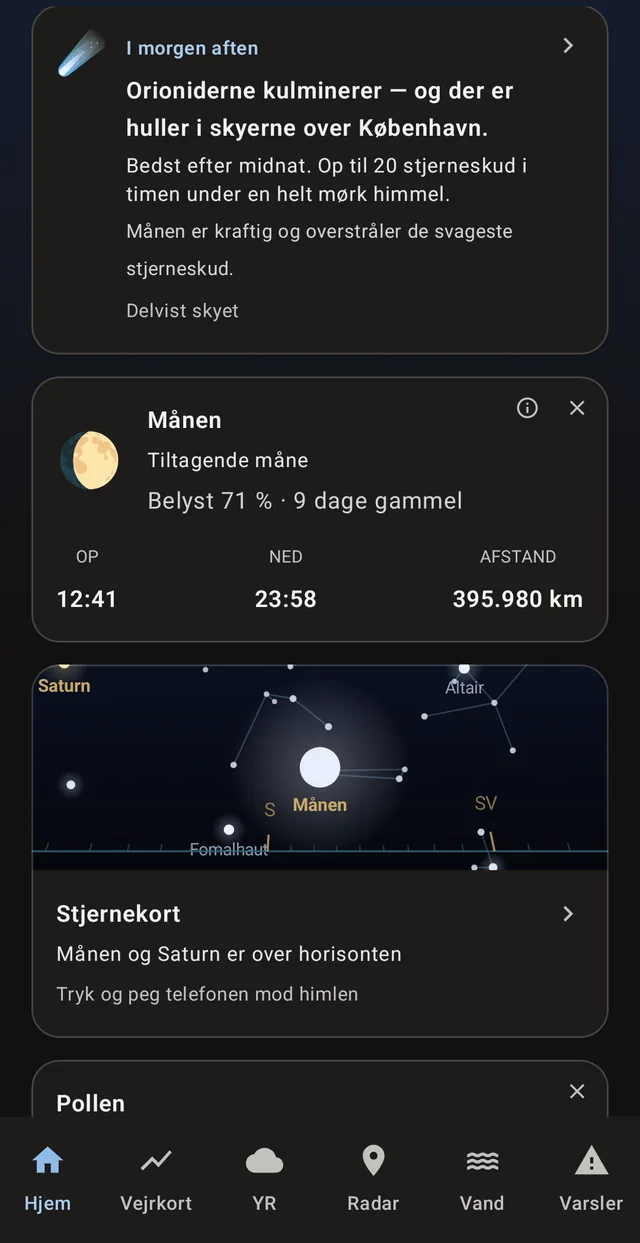
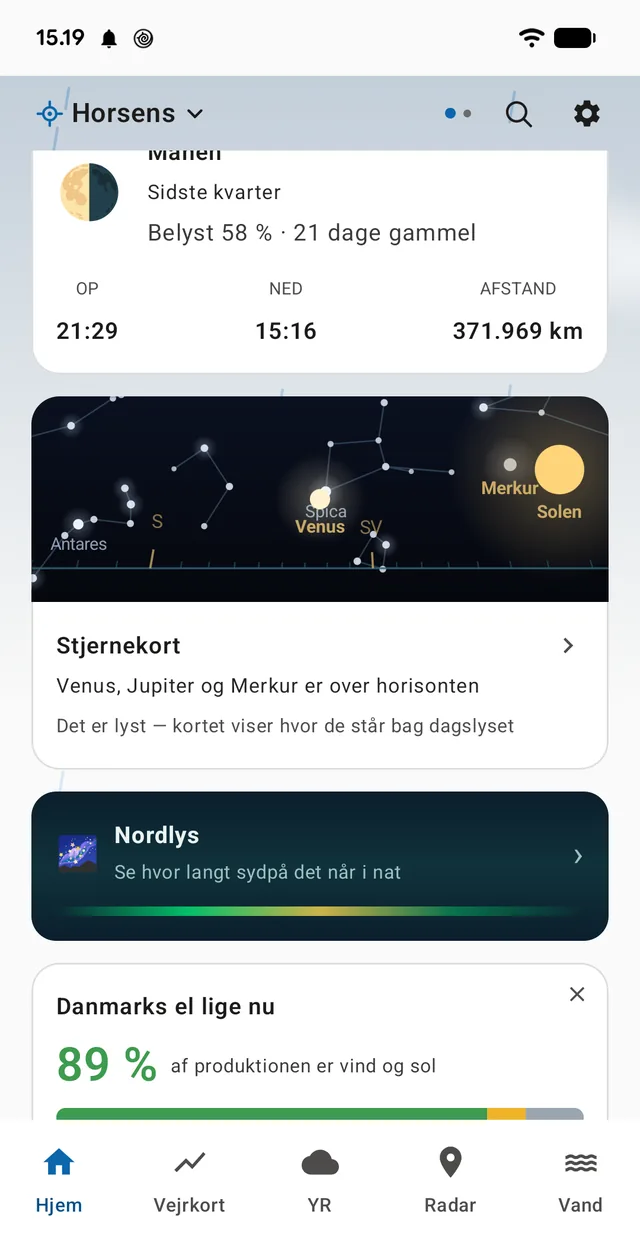
An astronomy app can tell you the Orionids peak tonight. It cannot tell you whether the sky is clear over your town. A weather app can — which is why the screenshot reads 'The Orionids peak — and there are gaps in the cloud over Copenhagen', with the note that the Moon is bright enough to drown out the faintest meteors. Crossing the sky with our own forecast is the whole reason this lives here.

The card on the front page always shows the next event with a countdown — meteor showers, full and supermoons, solar and lunar eclipses, solstices and equinoxes — and within two days it also says whether it will be clear. Beyond that it does not, because that would be a promise nobody can keep.

The eclipses come from NASA's official tables, but NASA only states which continent they are visible from. The app works out the altitude of the Moon and the Sun for the moment and for your position: of the 28 eclipses up to 2040, only 20 are actually visible from Copenhagen. The rest are below the horizon, and the app does not promise them.

Aurora comes from NOAA's space weather service. The alert here only fires at Kp 6 — Denmark sits at 55–57° north, and a message at Kp 4 is a false alarm. If you want to watch for it yourself there is a whole map for that; see the section below.

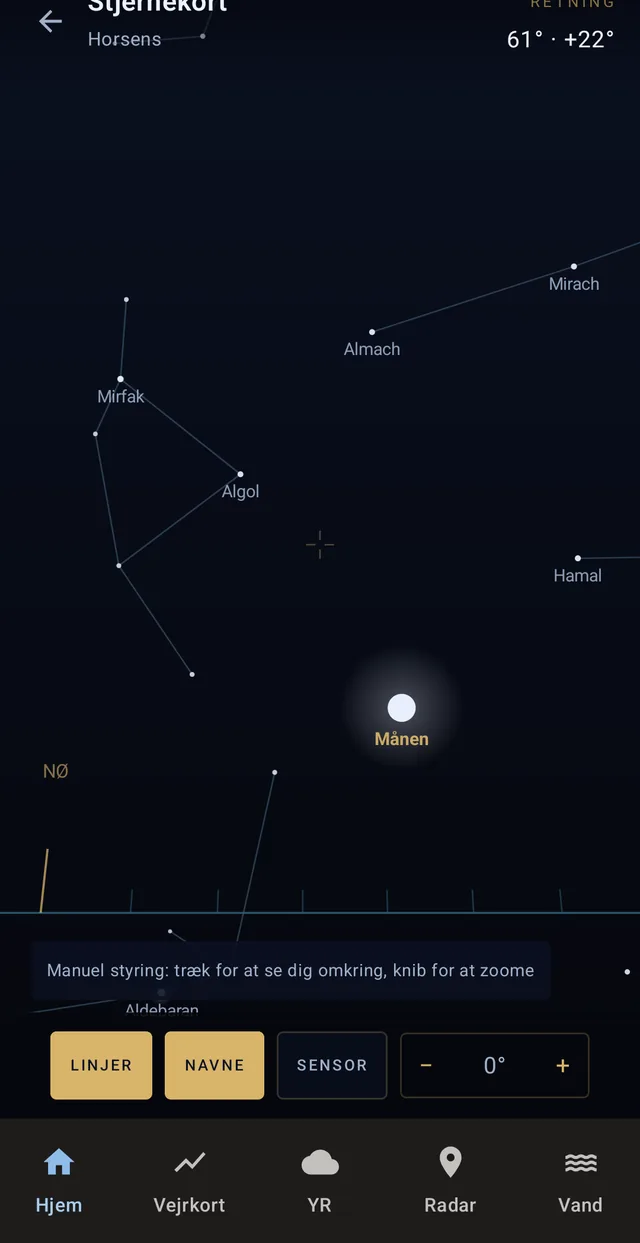
The star chart is computed entirely on the device and works without a network. Point the phone at the sky and the chart follows; turn the sensor off and you can drag around the sky with a finger.

'The Orionids peak — and there are gaps in the cloud over Copenhagen.' Below it, the Moon's phase and distance, and the star chart over your address.
Full-screen star chart: the Moon, Perseus and Andromeda over the town, with the horizon and compass points drawn in. Computed locally from date and position.
11

Aurora: the answer is often no — and then the app says why

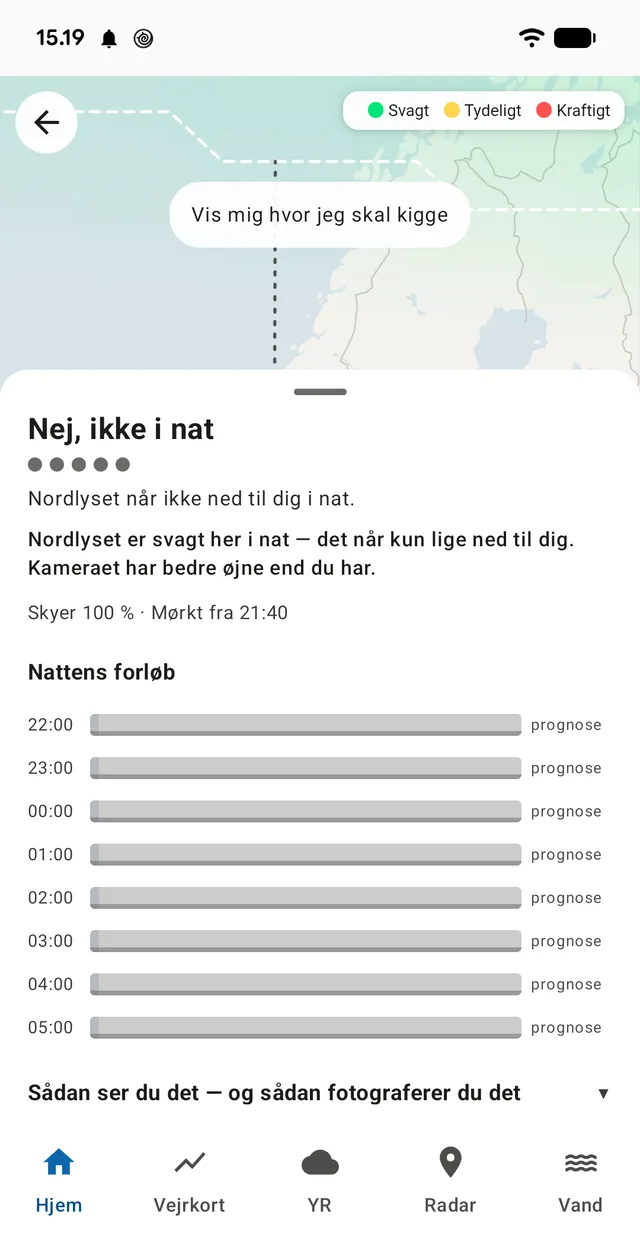
Most aurora apps answer with a Kp number. A Kp number does not say whether you can see anything from where you are standing. Byvejr multiplies five things together instead: activity, darkness, cloud cover, the moon and — when it has been fetched — the solar wind.

The answer is one of five levels, and 'camera only' is a real level, not a footnote. In Denmark it is the most common outcome: the aurora is there, but the eye sees a grey haze while the phone's ten-second exposure catches the green. An app that only says yes or no sends people out and disappoints them.

If the answer is no, the app says which of the five is blocking. 'The aurora is active right now — but there is 90% cloud over you' is the sentence no other aurora app can write in Denmark, because none of them has DMI's cloud cover. And the figure costs nothing: it is already in the forecast the app has cached on disk — it was simply thrown away because it was only used to pick a weather symbol. So the aurora map never fetches weather.

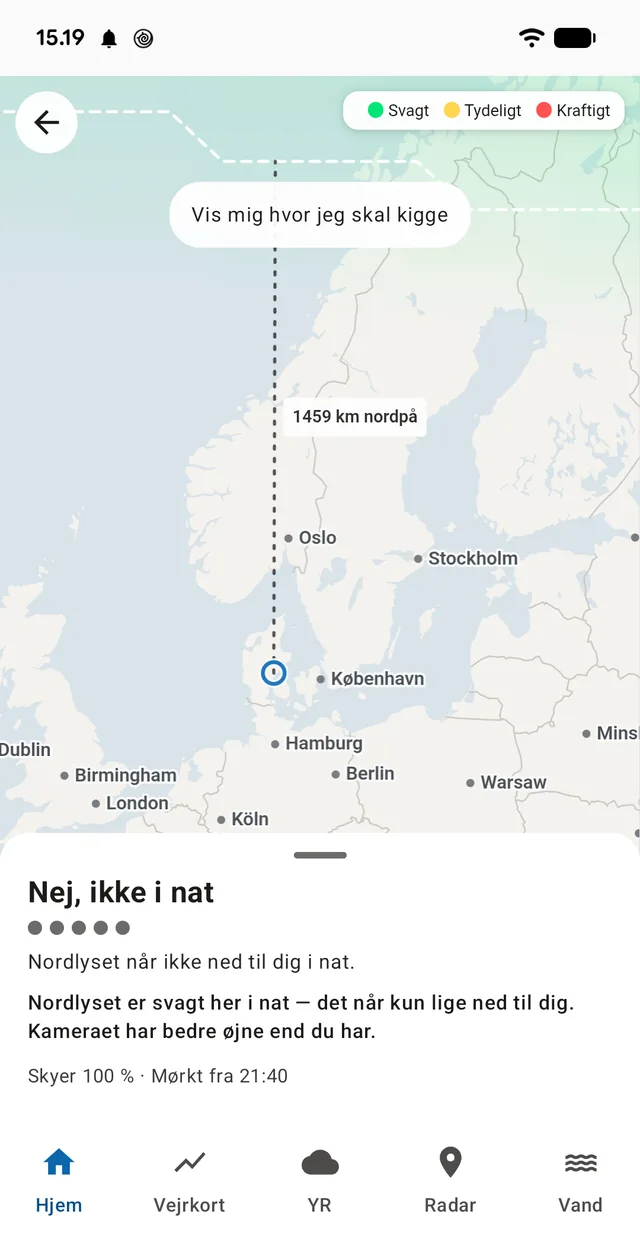
The map draws the oval and the two boundary lines, and how far north the edge stands right now — 1,459 km in the picture. Zoom is locked to five steps: the grid is one degree, and more zoom would be false precision.

'Tonight's course' runs hour by hour through to dawn. The first ninety minutes come from NOAA's OVATION grid, which knows the geography — that is how long the solar wind takes to reach us from the measuring station. Beyond that only the Kp forecast exists, in three-hour blocks with no geography, and those hours are drawn semi-transparent and marked 'forecast'. You have to be able to see when the app knows and when it is making an informed guess.

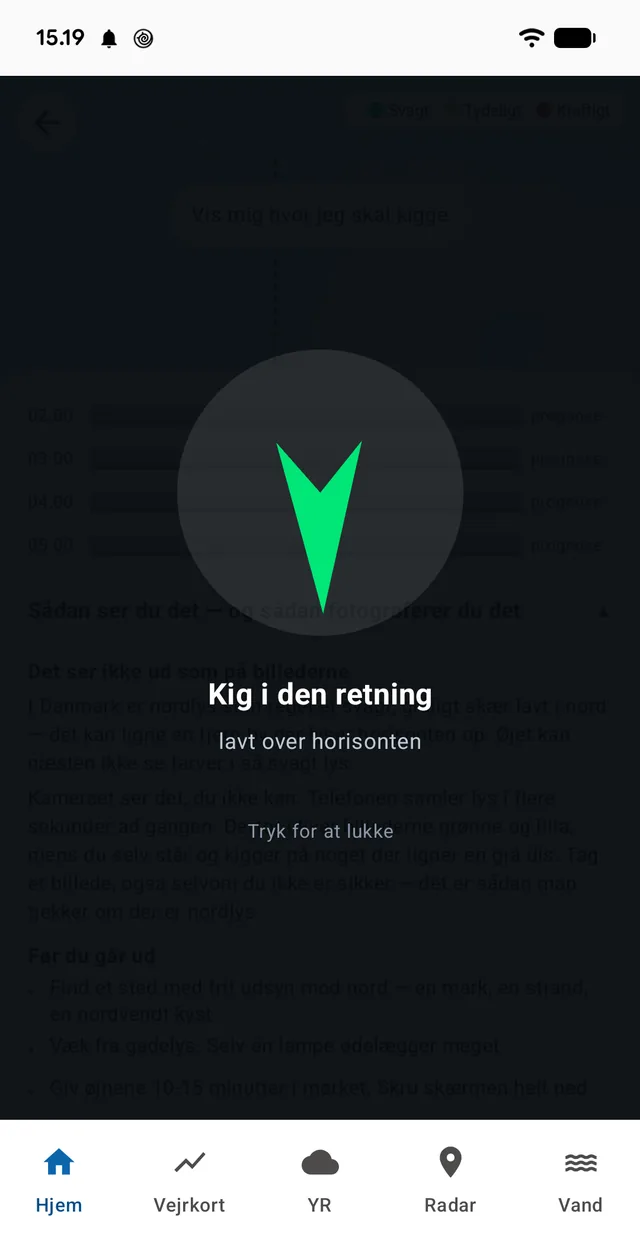
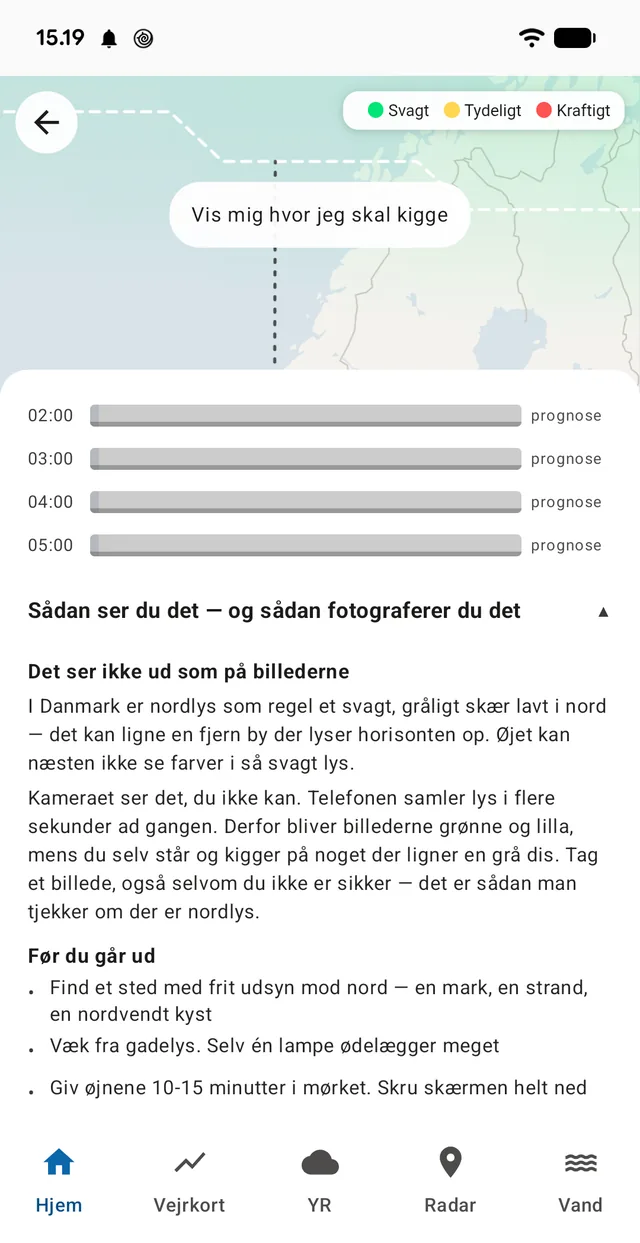
Finally, two things an aurora app rarely has: an arrow that turns with the phone and says which way and how low above the horizon to look — and a short guide explaining that it does not look like the photographs, plus what to do before you go out: a clear view north, away from streetlights, ten minutes for your eyes, screen brightness right down.

The tile on the front page hides itself outside the season, and the season is worked out from the sun's altitude rather than from dates. In Denmark that comes to roughly 20 August to 20 April — but the boundary moves with latitude, and a fixed date would be wrong in both Tromsø and Hamburg.

  • Five factors, not one Kp number: activity, darkness, cloud, moon and solar wind
  • 'Camera only' is a level in its own right
  • If the answer is no, the reason is stated — including when it is the cloud
  • Hours based on Kp are marked 'forecast' and drawn fainter
  • Cloud cover is read from the app's own cache — the map never fetches weather
The boundary line with the distance north, and the answer in plain words: 'No, not tonight' — with the reason below.
Tonight's course hour by hour. Every hour here is marked 'forecast', because it rests on Kp rather than the grid.
'Look that way — low above the horizon'. The arrow turns with the phone.
The guide says it straight out: it does not look like the photographs.
12

The numbers, six at a time

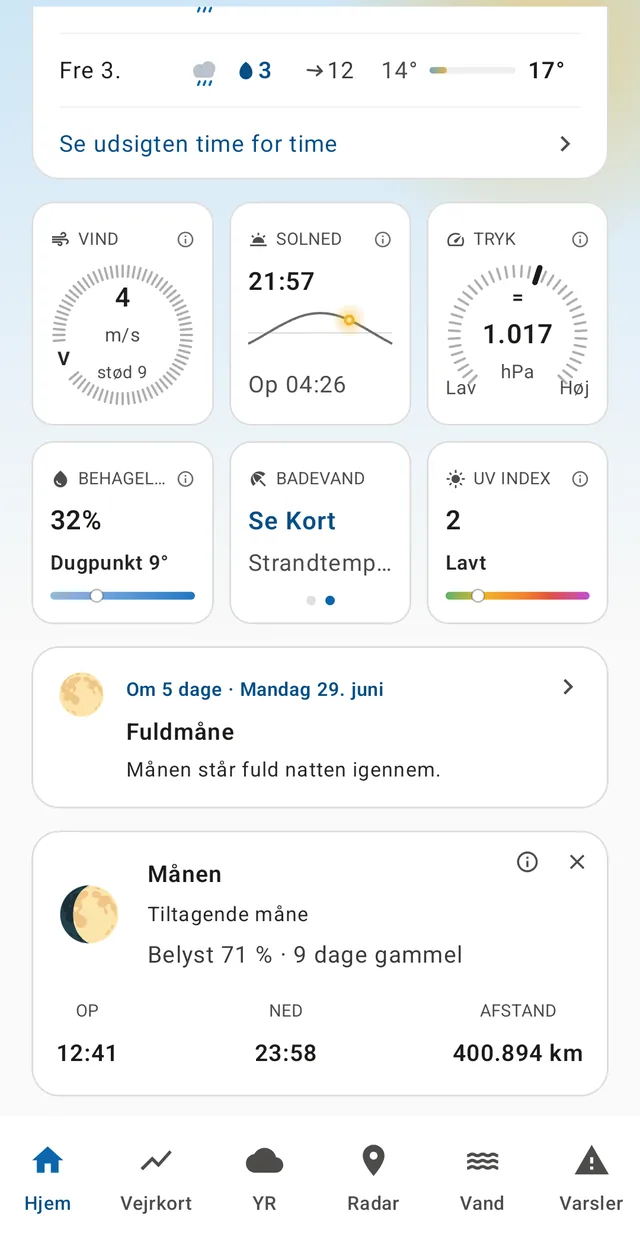
Below the forecast sit the figures you normally have to dig for: wind with gusts and direction, sunrise and sunset drawn as an arc with the sun's position on it, air pressure on a low-to-high scale, humidity with the dew point under it, the UV index — and a tile that pages between bathing water temperature and the sea level in your harbour.

Humidity is not given as a raw percentage, because 90% at 5 °C is an autumn morning and 90% at 25 °C is muggy. It is named — dry, comfortable, humid, very humid, foggy — and the dew point says when the air reaches it, which is when windows mist over and fog can form.

Every tile has an ⓘ explaining what the number means and where the thresholds are.

Wind, sun, pressure, humidity, bathing water and UV. Tap ⓘ for the reasoning behind the number.
13

Your places — and their own time

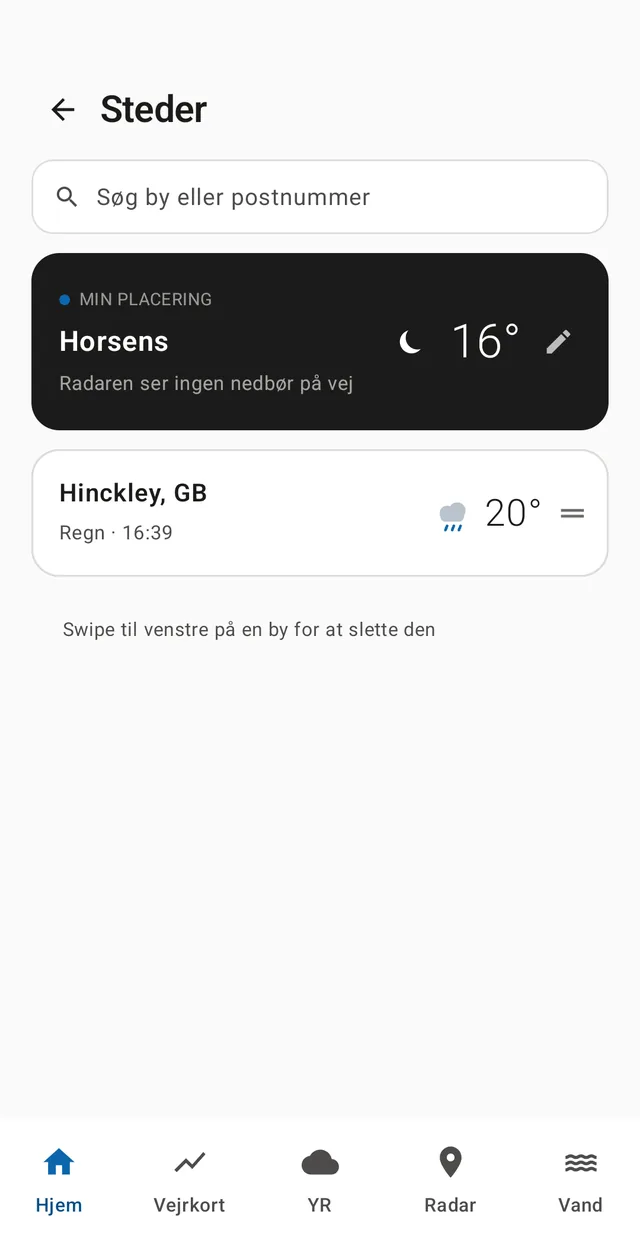
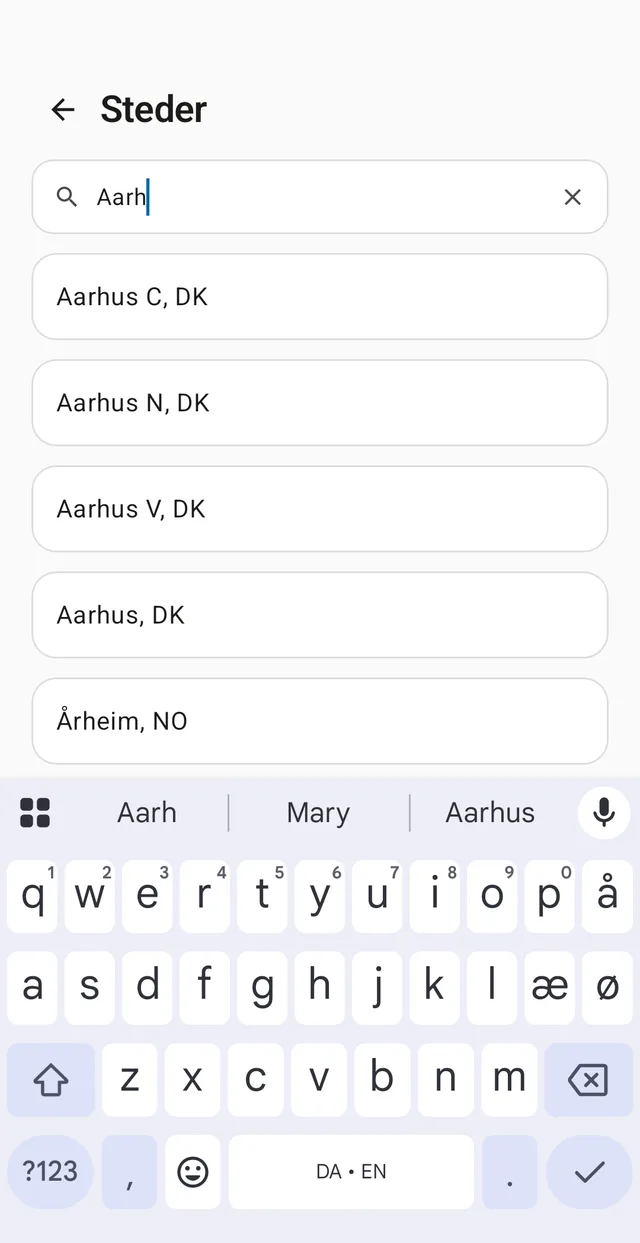
The search field knows Danish towns and postcodes from Denmark's official address register, and the rest of the world besides. Saved places sit in a list, are swiped away when no longer needed, and are switched between with a swipe on the front page.

Every place remembers its own time zone. Look up a Danish town from France and 'rain at 14:00' is still Danish time, because that is when the rain falls. And if you have a town in England saved, the clock next to it is English time. It sounds obvious and is not: the bug was found by a user in Haux, France, whose front page ran two hours early because the zone was guessed from the longitude.

My location at the top, saved places below — each with its clock in its own time zone.
Search knows Danish postcodes and town names — and the rest of the world.
14

You decide what the front page says

Pollen counts, the Moon, the star chart, the aurora map, Denmark's electricity production right now and the sea level in your harbour can each be switched on and off. Turn something off and it is not fetched either — the app spends neither battery nor data on content it is not showing.

Notifications are split up so you can say yes to one and no to another: a warning before the rain starts, dangerous weather (optionally only for your own part of the country), a morning summary at 07:00, and the sky events individually — aurora, meteor showers, eclipses, moon and seasons.
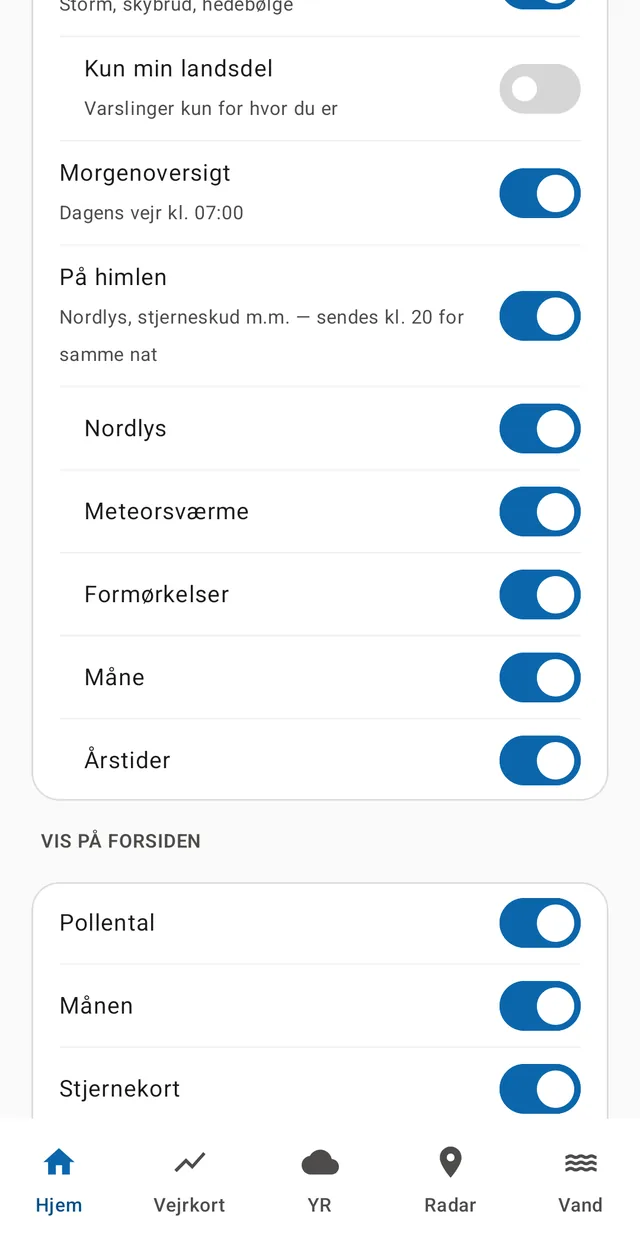
Sky notifications are sent at 20:00 for that same night, never during the night, and only when it is not overcast. There is at most one per category per day.

The aurora tile on the front page. It fetches nothing and hides itself in summer.
Theme, live background and the first three notification switches.
Sky notifications per category, and the list of what may appear on the front page.
15

Built to open fast and to fail gracefully

Every network call has a timeout and one retry. If nothing answers, the saved forecast is shown with a clear '(saved)' mark and a message explaining why — never a blank screen. Decline location access and the last saved town is used instead.

Only what is shown gets fetched. DMI's open API has a per-IP limit, and an app that pre-fetches everything hits it — after which even ordinary forecast calls are refused for minutes. Radar nowcast, sea level, pollen, electricity and moon are therefore fetched only once their tile is switched on.

The theme follows the phone but can be locked to light or dark. The live background on the front page follows the weather and the time of day — stars at night, a hazy sun by day.
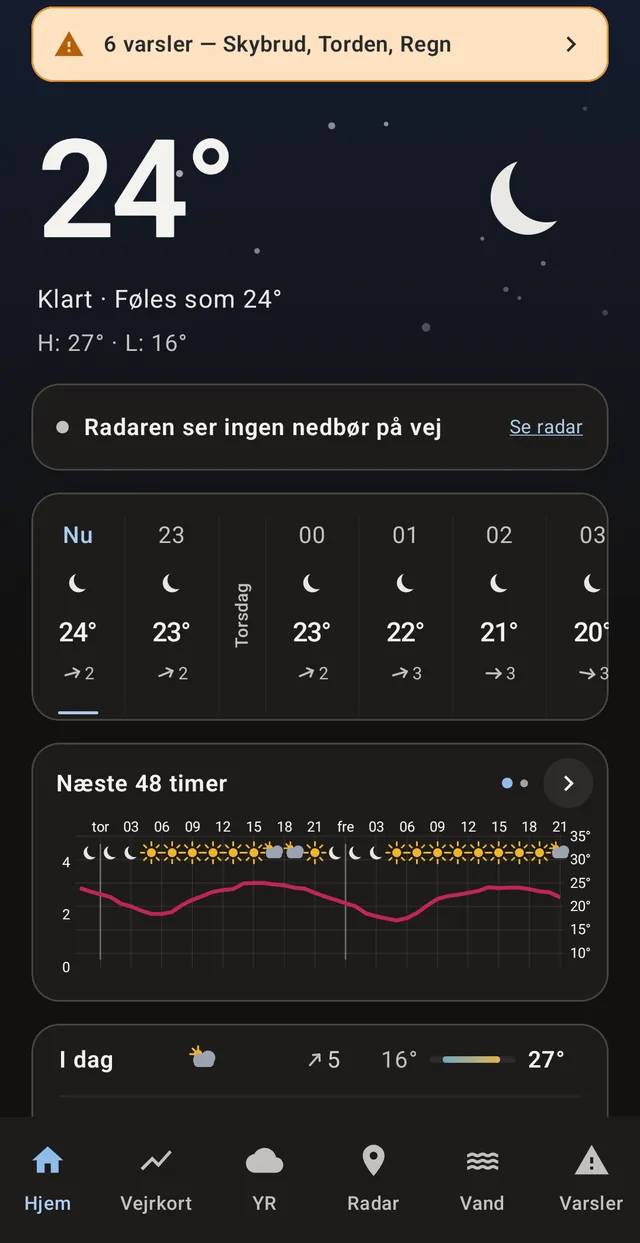
Dark theme. The background follows the weather and the time of day.
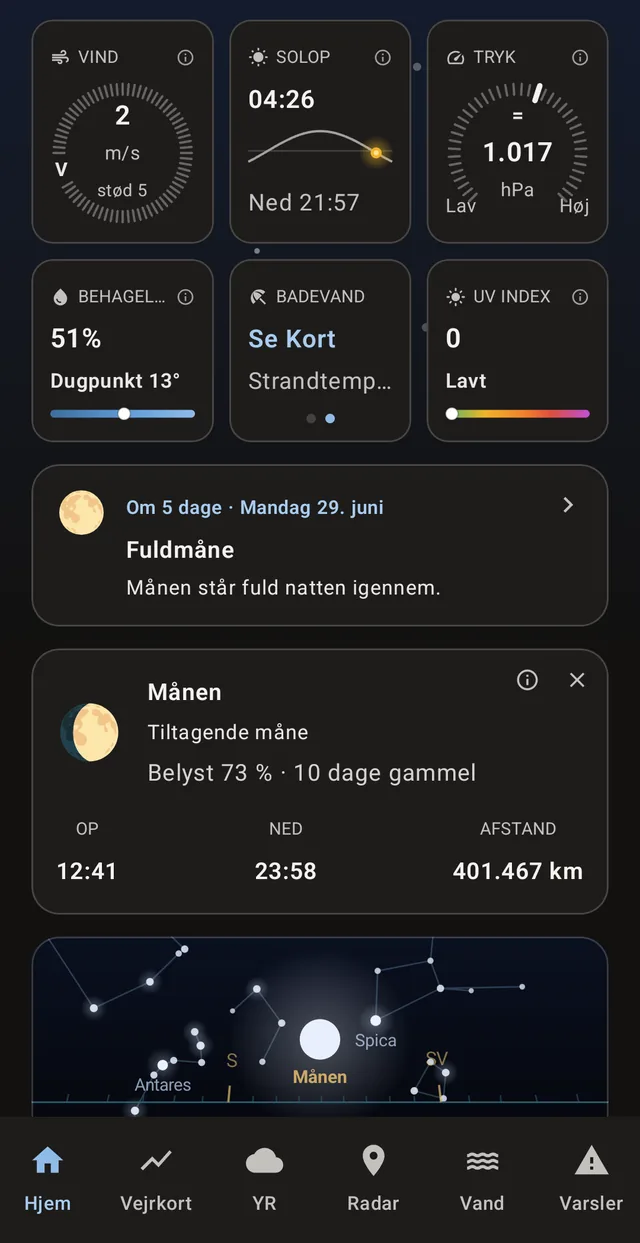
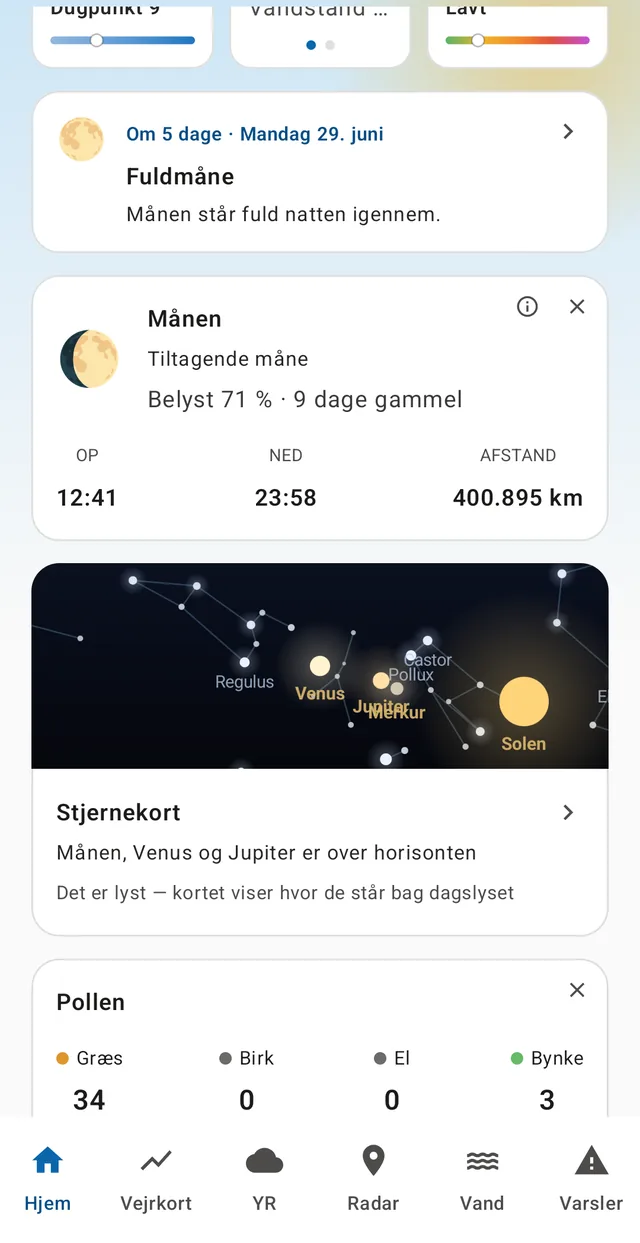
The same front page in dark: key figures, the full moon in five days, and the star chart.

Where the numbers come from

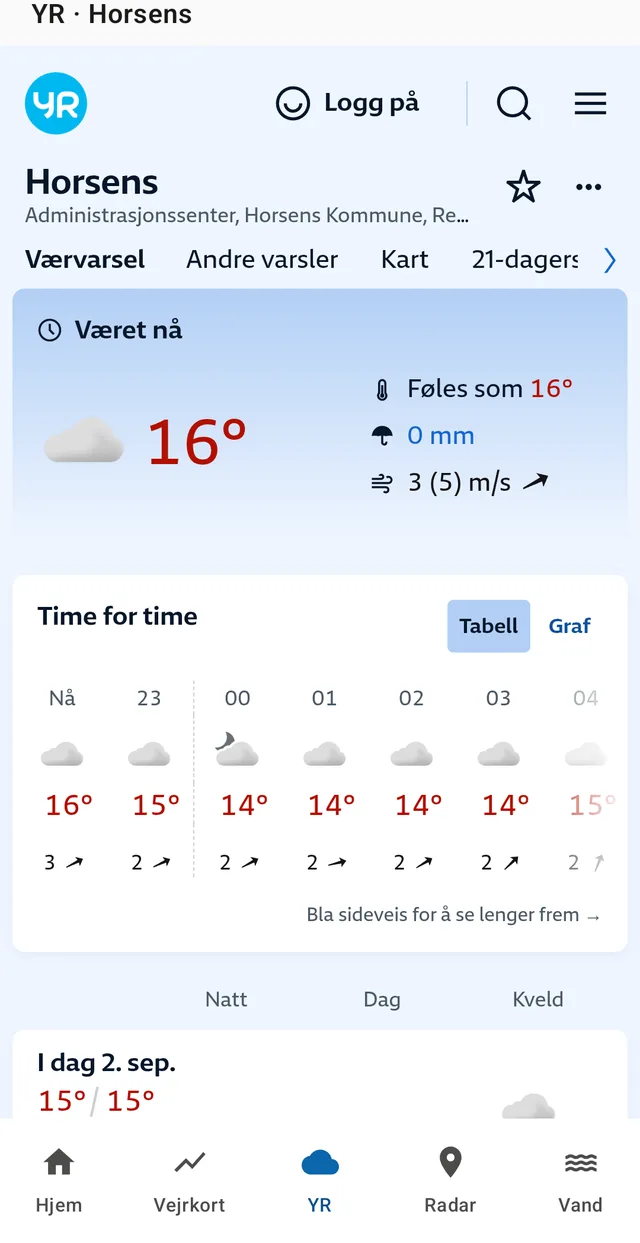
Everything in the app is public data from named sources. There is no in-house model, no reworking of the figures, and the source is always printed next to the number.

DMI — HARMONIE and NinJo
Conditions now and the hours ahead, in Denmark and northern Europe
Yr / MET Norway
The ten-day outlook, the second opinion, and the world outside DMI's domain
DMI radar imagery
'Precipitation ahead' — nationwide two-hour projection
RainViewer
The precipitation radar with playback
MeteoAlarm and DMI
Official warnings per municipality, with DMI's own wording
DMI Lightning Data
Every recorded strike in and around Denmark — for the map and for the alert
DMI's oceanographic model
Sea level and tides in the harbours
DMI's measuring stations
Rain gauges and sea temperature
TrygFonden’s coastal lifeguards and Den Nordsjællandske Livredningstjeneste
Bathing water temperature measured at the beaches
PULS via Denmark’s Environment Portal
Registered sewer and stormwater outlets for the overflow map
Denmark's address register (DAWA)
Postcode search and place names from coordinates
CAMS via Open-Meteo
Pollen counts for grass, birch, alder and mugwort
Energinet
Danish electricity production right now
NOAA Space Weather Prediction Center
Aurora forecast (Kp index) for the alert
NOAA SWPC — the OVATION grid
The auroral oval: probability per degree, about 90 minutes ahead
NASA GSFC
Solar and lunar eclipses through 2040
OpenStreetMap, Natural Earth, GeoNames and SDFI
The base map beneath every map layer