All apps
Energy · DK

Elpris

Hourly Danish electricity prices, so you can use power when it is cheapest.

What it does

Elpris shows the hourly spot price for your Danish price area, today and tomorrow, so you can move laundry, dishwashing and charging to the cheapest hours.

  • Hourly prices for today and tomorrow
  • West (DK1) and East (DK2) Denmark
  • The cheapest hours at a glance
  • Home screen widget
How it works

The price you actually pay — hour by hour

Most electricity price apps show the spot price. That is less than half the bill. Elpris adds your grid company's tariff, the state duties and VAT on top, and shows the number that actually lands on your meter — for every hour today and tomorrow.

01

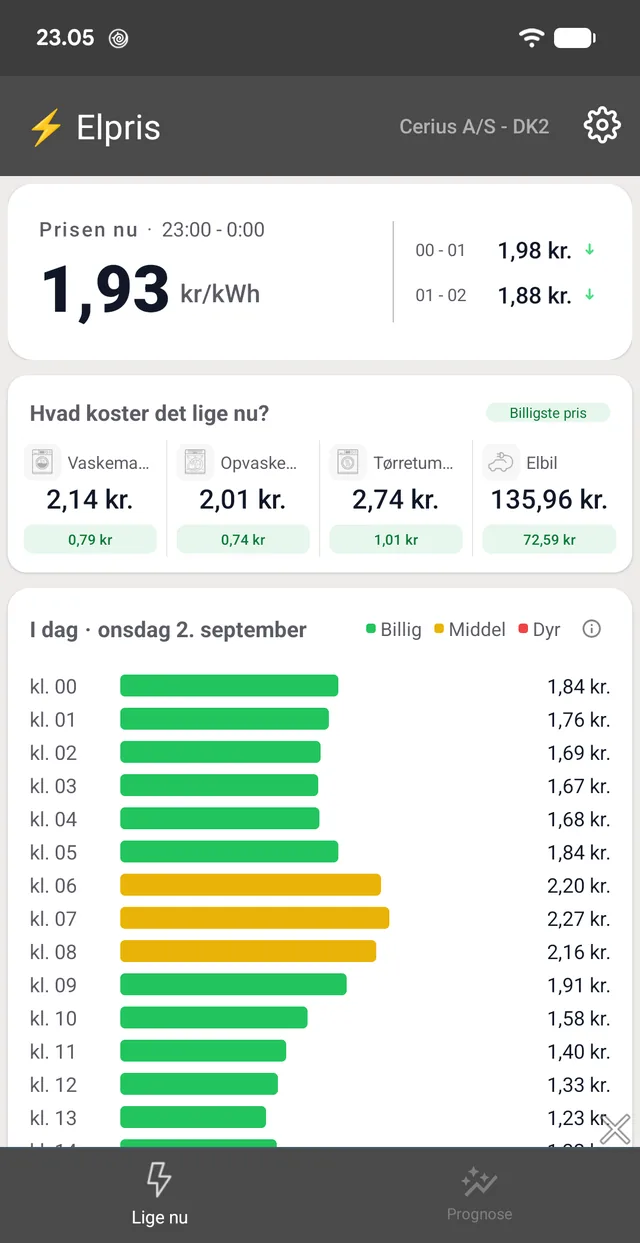
The price right now, in kroner

At the top sits the hour you are in and what it costs per kWh — not the spot price, but the total including grid tariff, duties and VAT. Next to it are the following two hours with an arrow, so you can see whether it is worth waiting half an hour with the dishwasher.

Below that, kroner instead of øre: what it costs to run a washing machine, a dishwasher, a tumble dryer or charge the car right now. The figures use ordinary consumption values, and the small green label under each shows what the same job would cost in the cheapest hour of the day — so the difference is visible.

Your grid company and price area sit in the header, because both change the price: Cerius A/S in DK2 is not the same as N1 in DK1.

  • Total price per kWh, not the spot price
  • The next two hours with a direction arrow
  • Washing, dishes, drying and car charging converted into kroner
  • Grid company and price area always visible at the top
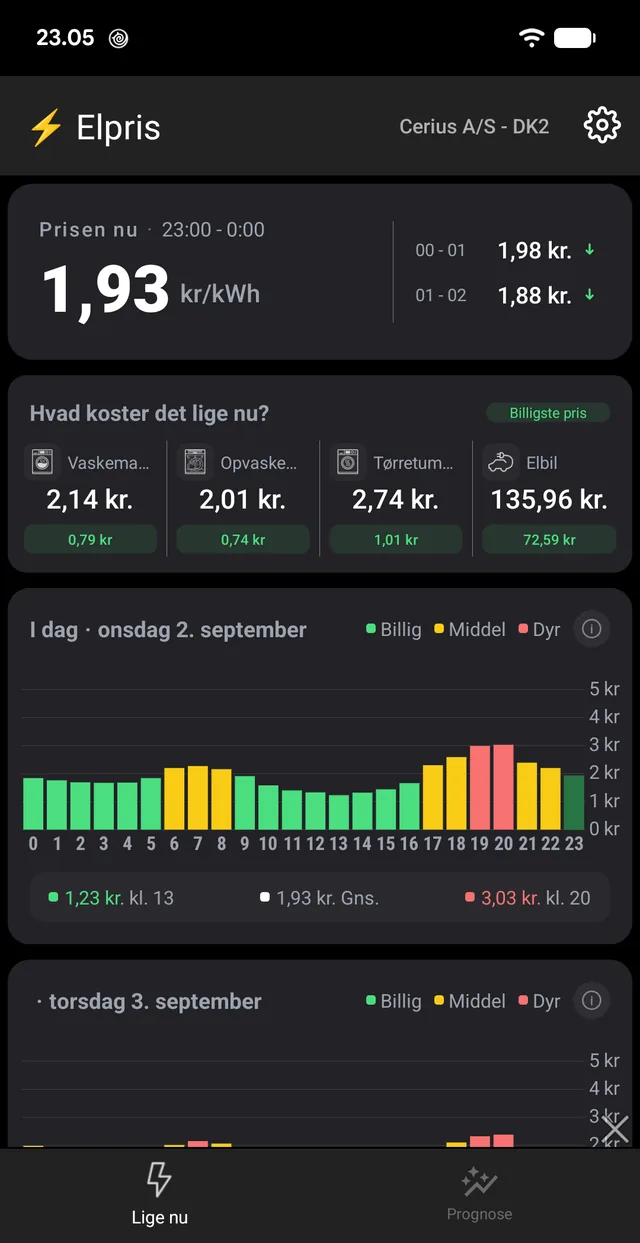
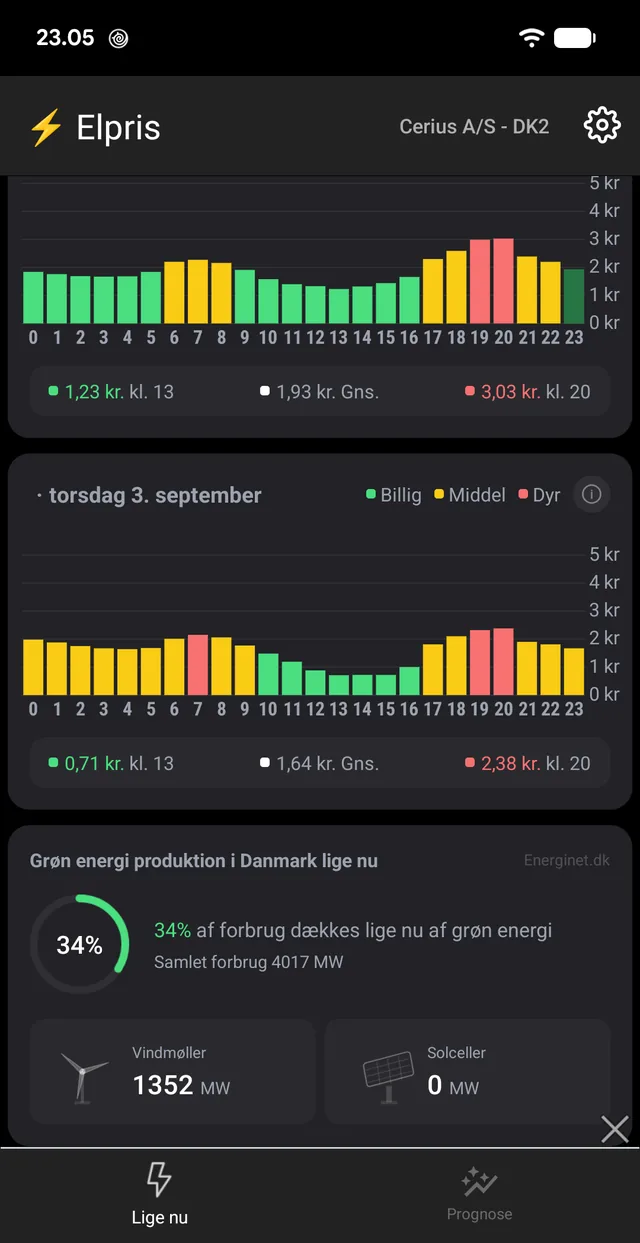
The price for the hour you are in, the next two hours, and what four ordinary appliances cost right now.
02

The day in colour — and every hour opened up

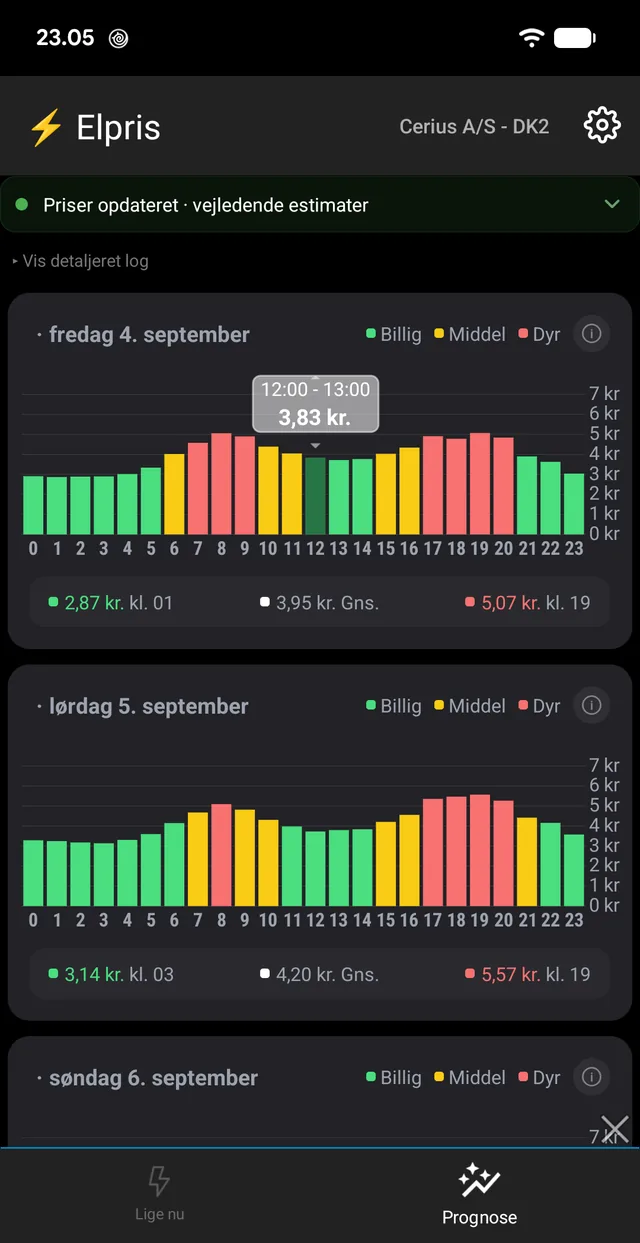
Today and tomorrow appear as two charts with one bar per hour, coloured green, yellow and red according to whether the hour is cheap, medium or expensive for that day. Under each chart sit the day's cheapest hour, the average and the most expensive, with times.

Tomorrow's prices land in the middle of the afternoon, when the Nordic power exchange has settled them. Until then the app shows only today — it does not invent numbers for hours nobody knows yet.

Tap a bar and it reports its own hour: time and price. Tap ⓘ and the whole calculation unfolds.

At the bottom sits Denmark's electricity production right now — how much of consumption is covered by wind and solar at this moment, and how many megawatts each is delivering. It is the same number that lies behind the cheap hours.

Today and tomorrow, and at the bottom how much of consumption is currently covered by wind and solar.
Tap a bar for that hour's price.
03

The arithmetic behind the price

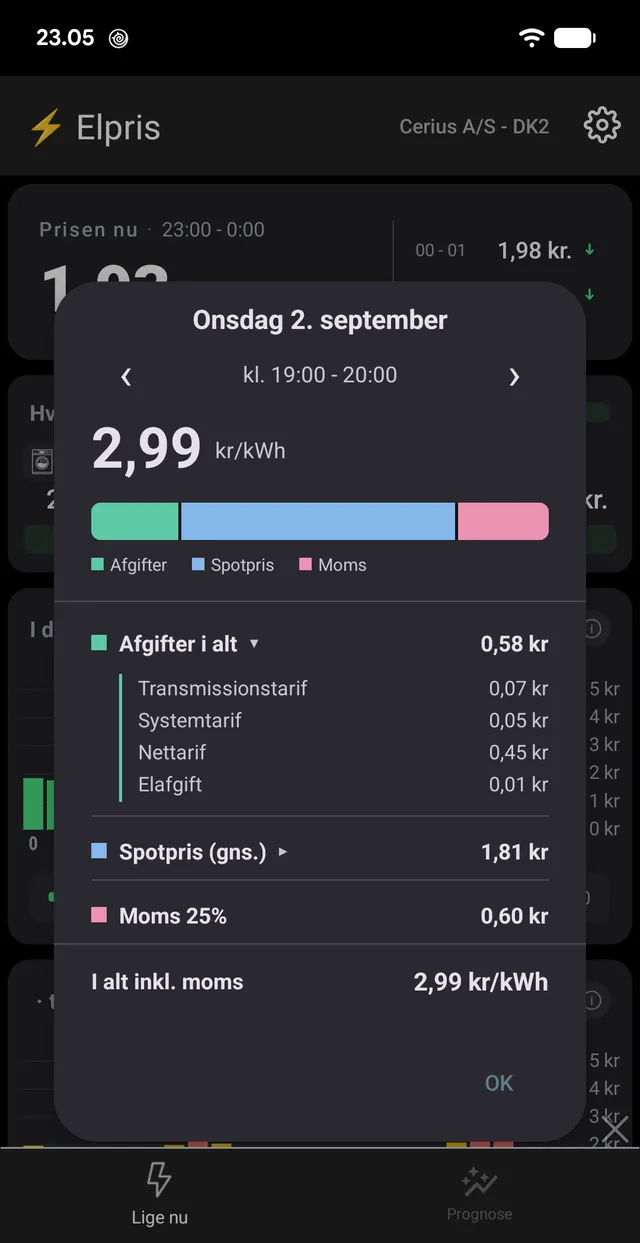
Behind ⓘ sits the hour's price split into what it is made of: duties, spot price and VAT, as a bar you can read at a glance. Unfold the duties and they appear one by one — transmission tariff, system tariff, grid tariff and electricity duty, each with its own amount.

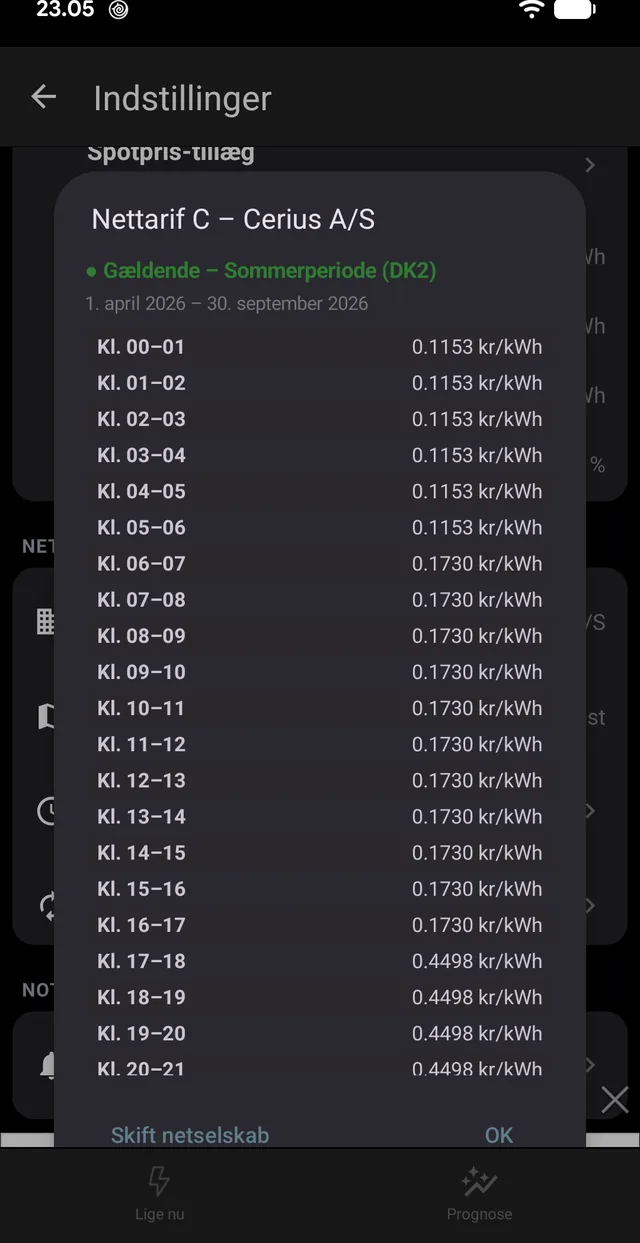
The grid tariff is the one that varies most, and it is not an average: the app knows your grid company's actual tariff sheet with low, high and peak load hour by hour, and which period of the year it applies to. Summer in DK2 is not the same as winter, and it shows up in every single hour of the chart.

The arrows at the top of the sheet page through hour by hour, so you can follow how the composition changes across the day. The spot price swings; the duties do not — and that is exactly why a doubling of the spot price rarely doubles the bill.

The hour's price split into duties, spot price and VAT — with the duties unfolded individually.
The grid company's actual tariff sheet, hour by hour, with the period of the year it covers.
04

Your grid company — not your electricity supplier

It is one of the most common misunderstandings on a Danish electricity bill: the grid company is not the supplier. You choose your supplier and can switch; the grid company owns the cables in the ground at your address, and that you cannot choose. The grid company sets the transport charge — and it often weighs more than the electricity itself.

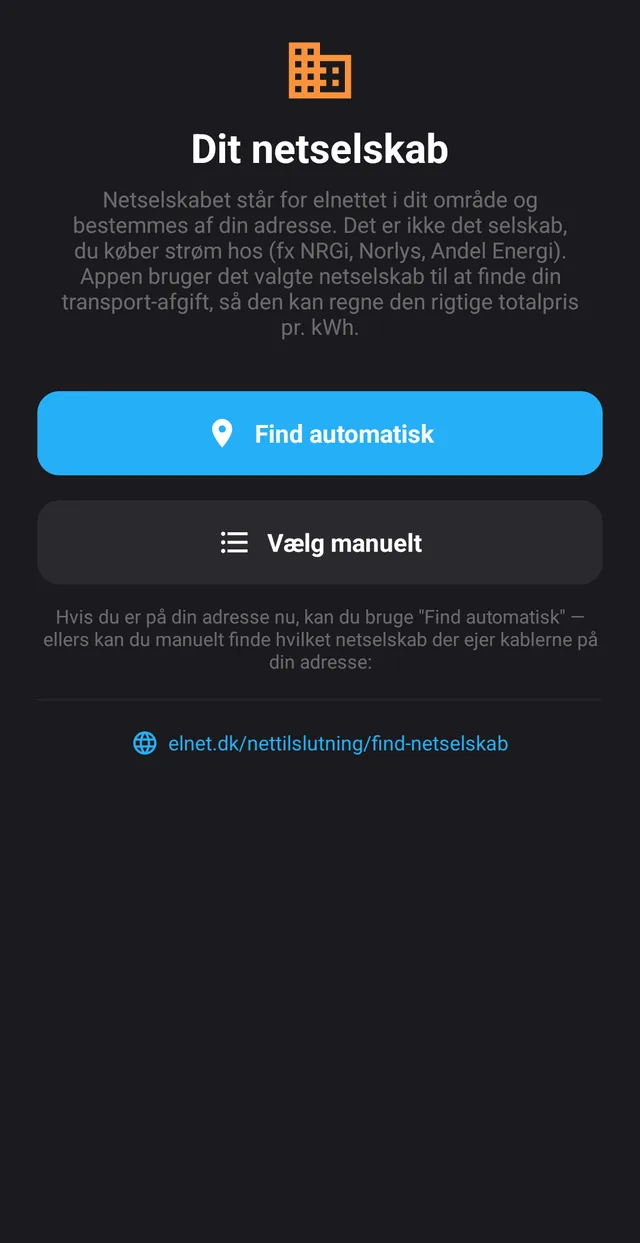
So the app asks one thing: who owns the cables where you live. Either it finds out from your location, or you pick from the list. After that the tariff is right, and the total is yours rather than a national average.

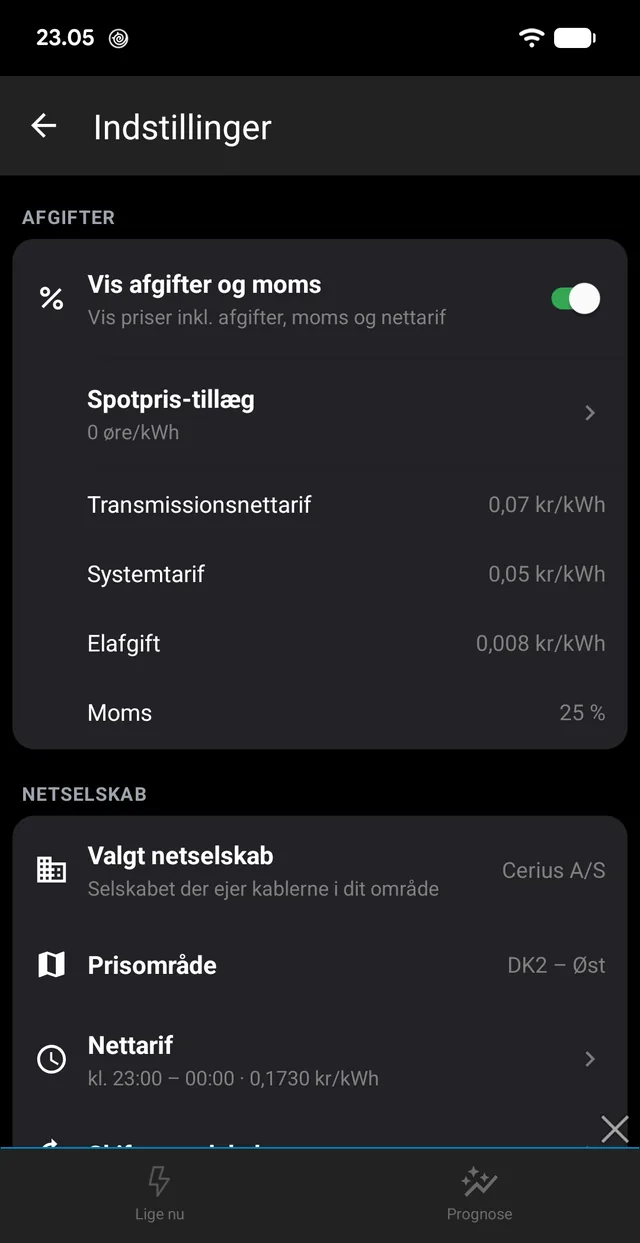
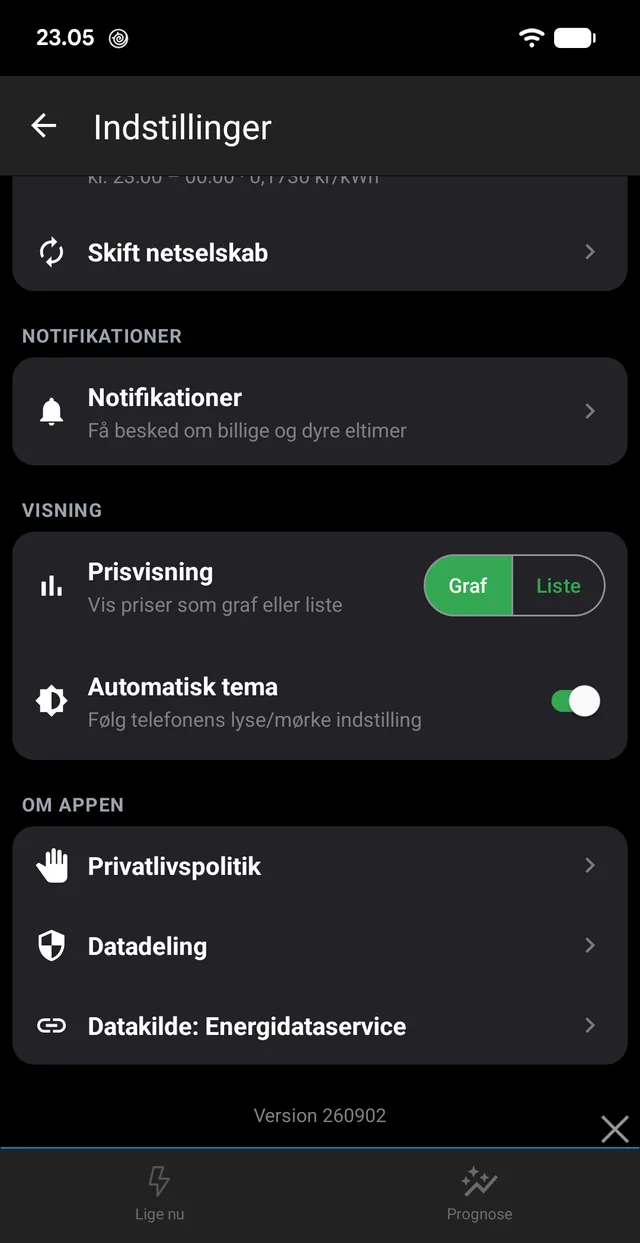
In settings the whole setup can be checked and corrected: the three fixed duties, VAT, any spot-price markup from your supplier, and the grid company itself. If you would rather see the raw spot price, switch off 'show duties and VAT' and the app shows that instead.

  • The grid company is found automatically or picked manually
  • A spot-price markup from your own supplier can be entered
  • Duties and VAT can be switched off if you prefer the raw spot price
  • Price area DK1 or DK2 follows from the grid company
The grid company owns the cables at your address — the app explains the difference and finds it for you.
Every rate is stated openly and can be corrected: duties, VAT, markup and grid company.
05

A forecast for the days nobody knows yet

The power exchange only settles tomorrow. If you want to plan a week ahead — when to charge the car, when to let the heat pump run — the numbers do not exist.

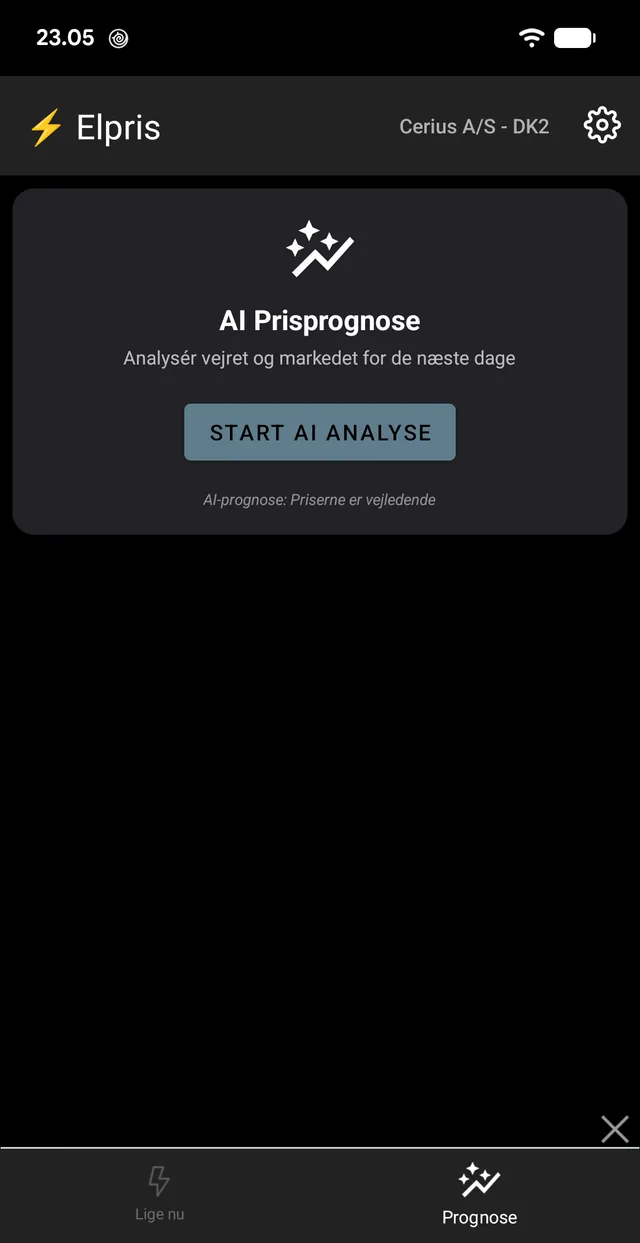
The forecast tab makes its own estimate. A machine learning model on the phone runs the weather forecast for six locations together with historical prices from Denmark and its neighbours — DK1, Swedish SE3, Norwegian NO2 and Germany — and writes a day's profile for the coming days in the same coloured chart as the rest of the app. Wind in the North Sea pushes the price down; still, cold weather pushes it up, and the model has seen enough of both to know the pattern.

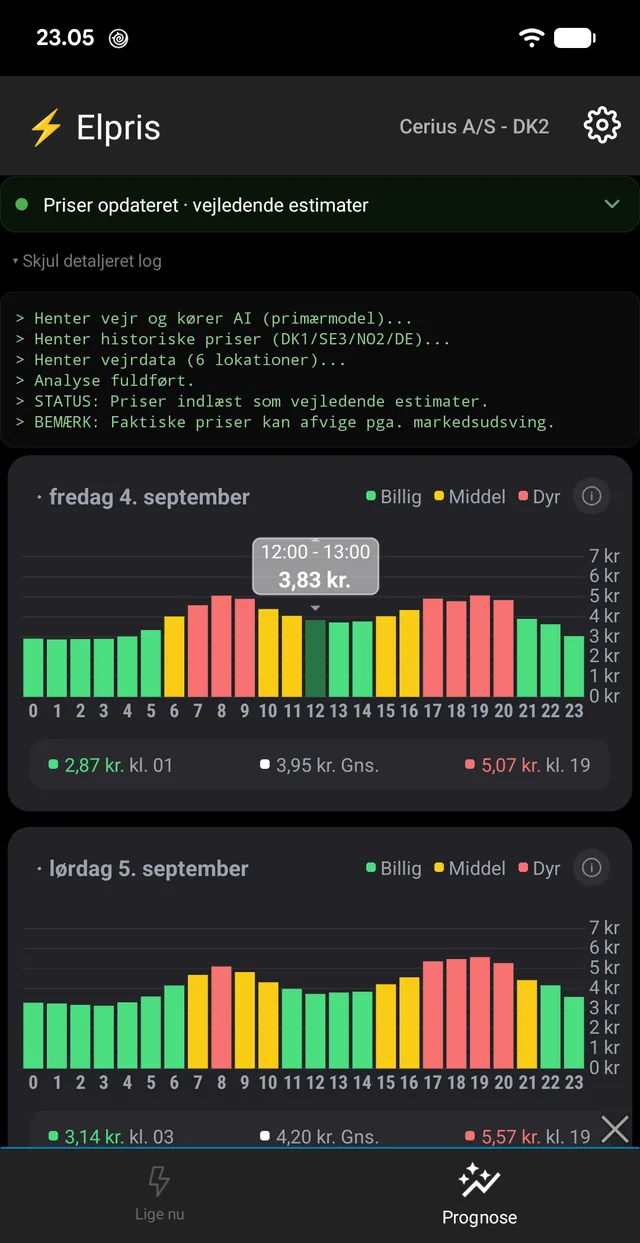
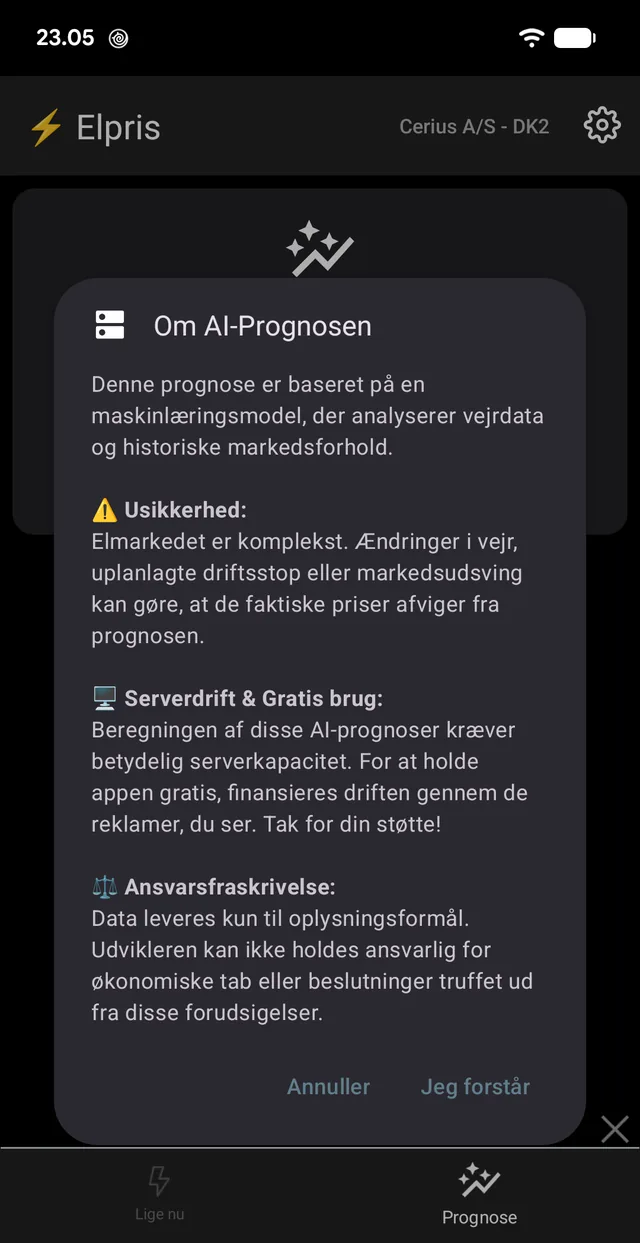
There is a detailed log you can unfold, so it is visible what was fetched and what was calculated. And the app calls it what it is: indicative estimates. The first time you press it, a page explains what the model can and cannot do — that the electricity market is complex, that unplanned outages and market swings can move the price, and that the numbers are for information rather than for making financial decisions blind.

The calculation runs on the phone. There is no account, and nothing about your consumption is sent anywhere.

Three days ahead in the same chart as the rest of the app — with cheapest, average and most expensive hour.
The log shows what was fetched: weather for six locations and historical prices from DK1, SE3, NO2 and Germany.
The caveat comes before the forecast, not after: estimates, not prices.
06

Told before the cheap hour, not after

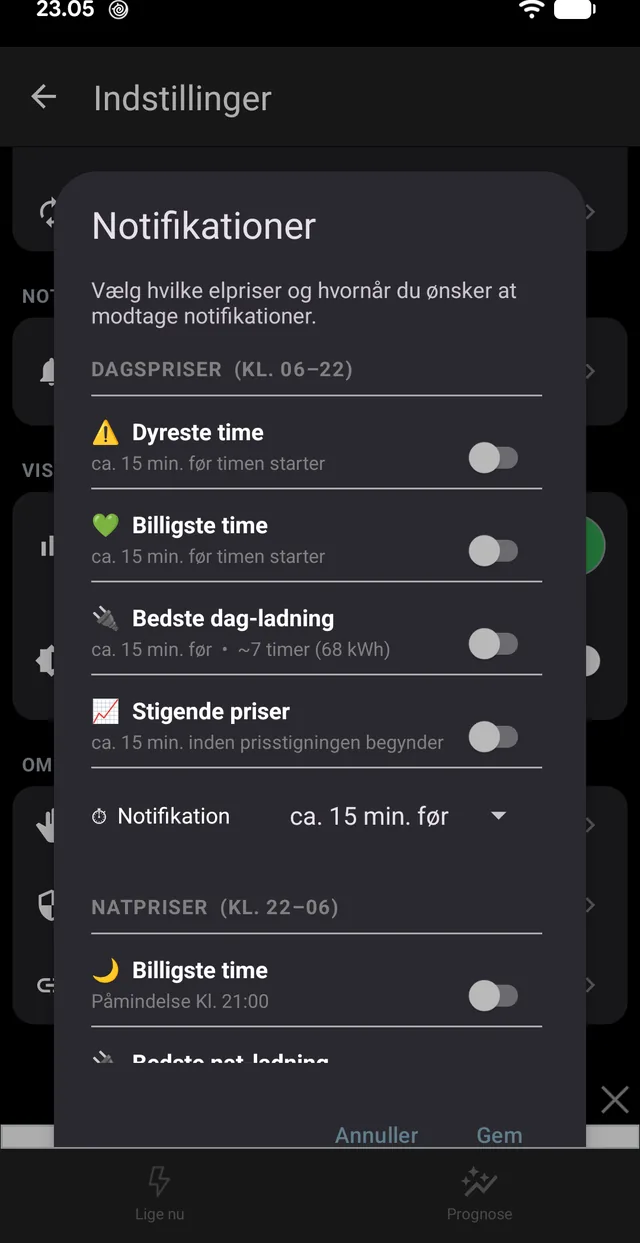
A price you discover the next day is useless. So the notifications arrive before the hour begins — a quarter of an hour ahead by default, and the interval can be set.

There are alerts for the day's most and least expensive hour, for when prices start climbing, and — for anyone charging an electric car — for the best continuous charging window: the app finds the run of hours that is cheapest together and says so before they start.

Day and night are split, so you can accept a 21:00 reminder about the cheapest hour of the night without being woken at three.

Most and least expensive hour, rising prices and the best charging window — day and night separately.
07

Chart or list, light or dark

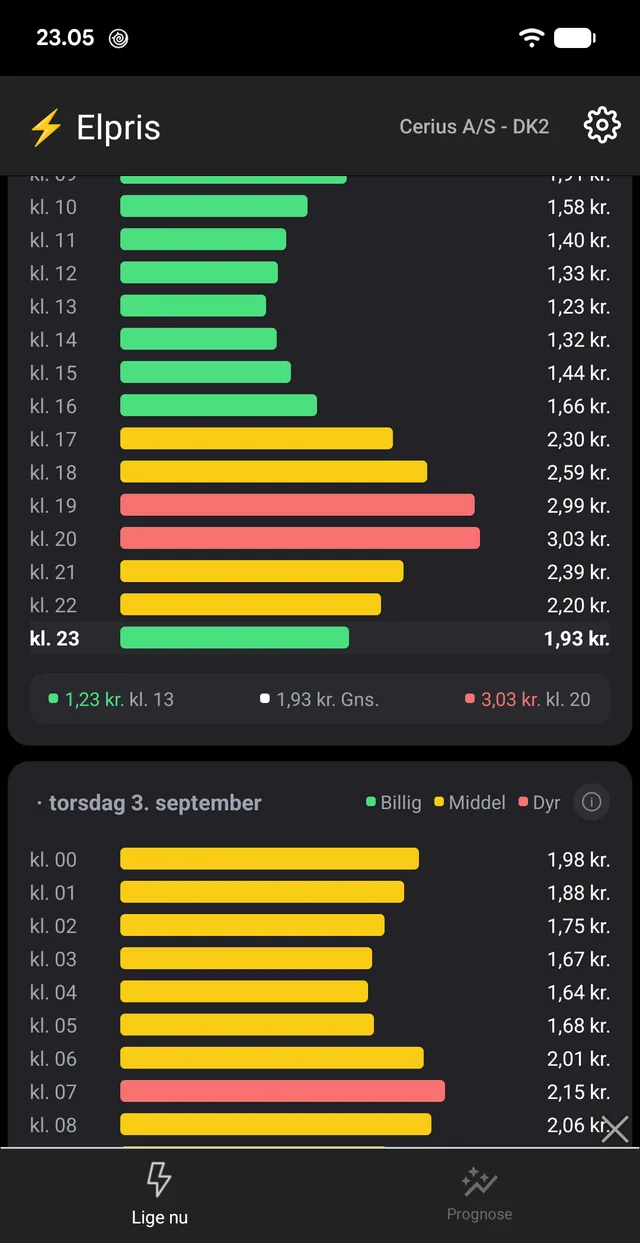
The chart is quick to read, the list is precise. The switch sits in settings, and the list shows every hour with its own bar and its own amount, with the current hour highlighted.

The theme follows the phone unless you lock it. And on the home screen the app can sit as a widget in two sizes: a small one with the hour's price in colour, and a wide one with the price, the direction and the cheapest hour of the day. The widget knows the whole day's prices, so it keeps working through the night without needing the app to wake it.

The list view: every hour with a bar and an amount, the current hour highlighted.
The same app in light theme.

Where the numbers come from

The prices are public data from the electricity market's own sources. The app has five sources for the same price and tries them in order, so a single broken server does not empty the screen.

Energi Data Service (Energinet)
Spot prices for DK1 and DK2 — the primary source
Nord Pool
Day-ahead prices and the 15-minute index, when Energinet is missing them
elberegner.dk
A third source for the same daily prices
appcode.dk
Our own backup file, if all three are down
Energi Data Service — tariff sheets
The grid companies' actual tariffs, hour by hour and per season
Energinet, 'Power System Right Now'
Danish electricity production now: wind, solar and total consumption
Open-Meteo (forecast and archive)
Weather data for the price forecast — six locations, plus history for the model
Nord Pool, historical prices
DK1, SE3, NO2 and Germany as background for the forecast